Figure 2.
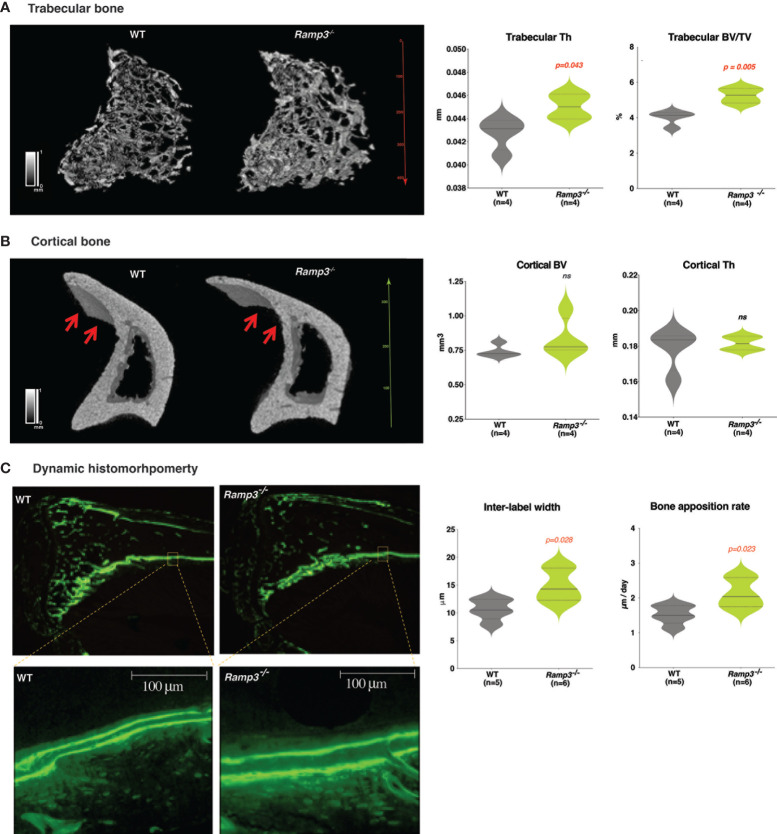
(A) Increase in the trabecular bone thickness and the bone volume/tissue volume ratio revealed through the 3D rendering of the microCT scan (left) and quantitative analysis (right) in Ramp3 -/- mice at 8 weeks of age. (B) Structural differences such as the thinner and more elongated tibial crest (red arrows) observed in the tibia cortical bone in the Ramp3 -/- mice at 8 weeks. Despite the thinner appearance of the cortical bone in the 3D model, the quantitative analysis does not suggest a decrease in the overall cortical bone volume in the Ramp3 -/- mice. (Black and white scale in the models: black =low, white=high). (C) Calcein-labelled tibia sections demonstrating dynamic histomorphometry. Ramp3 -/- bones have increased distance between the two successive calcein labels in the cortical bone (left). Significant increase in the inter-label width and bone apposition rate in the Ramp3 -/- mice detected from the dynamic histomorphometry quantifications (right). ns, Not significant.

