Figure 2.
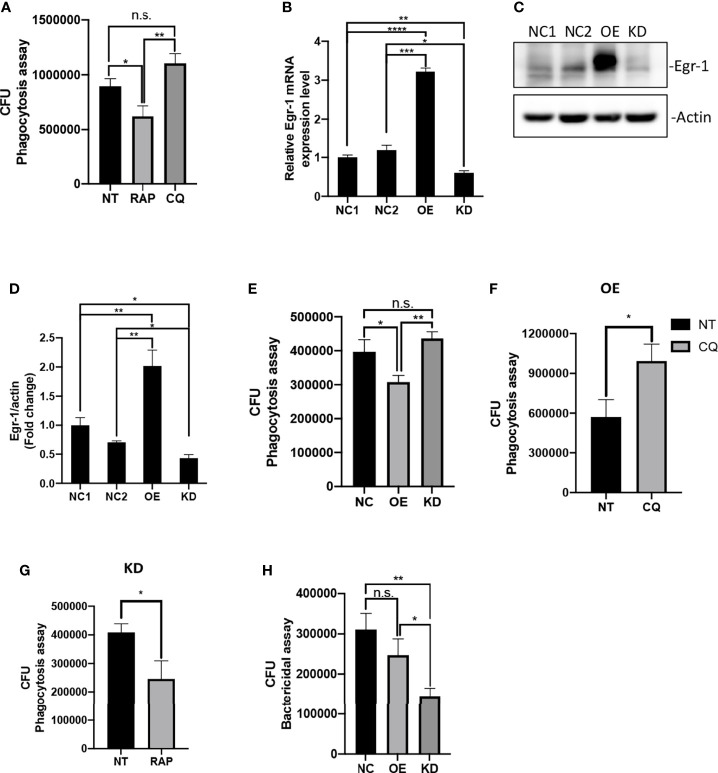
Egr-1 suppressed the phagocytosis of P. aeruginosa by macrophages. RAW264.7 macrophages were pretreated with 200 nM rapamycin (RAP) or 20 µM chloroquine (CQ) for 1 h or left untreated (NT). These cells were infected with P. aeruginosa PAO1 at an MOI of 20 for 1 h and lysed for phagocytosis assay (A). The CFU data represented the number of internalized bacteria within 1 h (n = 6 ± SEM; n.s., not significant, *p < 0.05, **p < 0.01). The RAW264.7 macrophage cell lines with stable Egr-1 overexpression (OE) or knockdown (KD) were constructed via lentiviral transduction. The transduction efficiency was assessed by real-time quantitative PCR and Western blot analysis. The Egr-1 mRNA levels in Egr-1 OE and KD cells as well as their negative controls NC1 and NC2 were normalized to endogenous control β-actin (B) (n = 3 ± SEM; *p < 0.05, **p < 0.01, ***p < 0.001, ****p < 0.0001). The blots for Egr-1 protein expression are representative of three independent experiments (C). Densitometry analysis of Egr-1 protein levels was normalized to actin, and data are presented as fold change (D) (n=3 ± SEM; *p < 0.05, **p < 0.01). The Egr-1 NC, OE and KD RAW264.7 cells were infected with P. aeruginosa PAO1 at an MOI of 20 for 1 h and lysed for phagocytosis assay (E) (n = 6 ± SEM; n.s., not significant, *p < 0.05, **p < 0.01). The Egr-1 OE and KD cells were pretreated with 20 μM CQ and 200 nM RAP, respectively, for 1 h or leafed NT. Subsequently, these cells were infected with P. aeruginosa PAO1 at an MOI of 20 for 1 h and lysed for phagocytosis assay (F, G). The P. aeruginosa-infected Egr-1 NC, OE and KD cells were infected for 3 h and lysed for bacterial killing assay (H). The CFU data represented the number of internalized bacteria survived within the cells after 3 h (n = 6 ± SEM; n.s., not significant, *p < 0.05, **p < 0.01).

