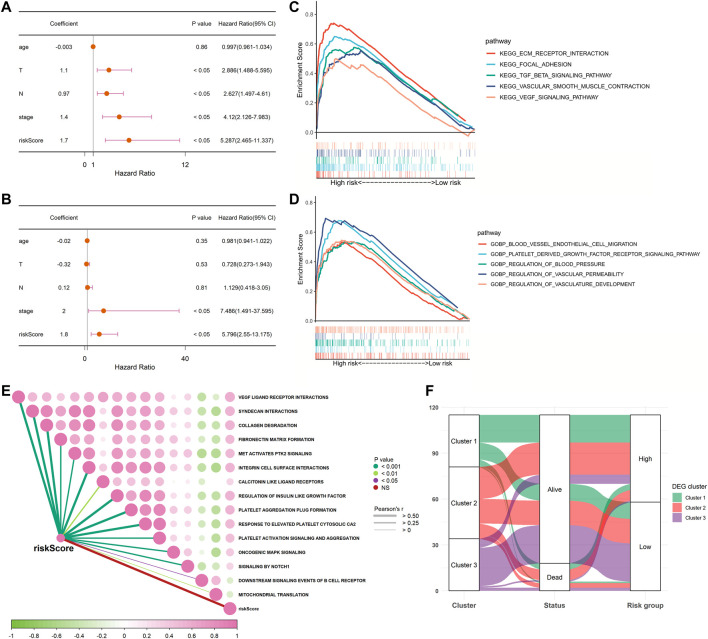
FIGURE 5.
Univariate and multivariate Cox regression analyses for the risk score and GSEA between low- and high-risk groups in TCGA cohort. (A) Univariate analysis for TCGA cohort. (B) Multivariate analysis for TCGA cohort. (C,D) Involved signaling pathways in two risk groups in TCGA cohort. (E) Correlation analysis of the risk score and pathways from the reactome gene set. (F) Alluvial diagram shows the changes of clusters, vital status, and risk groups in TCGA cohort.

