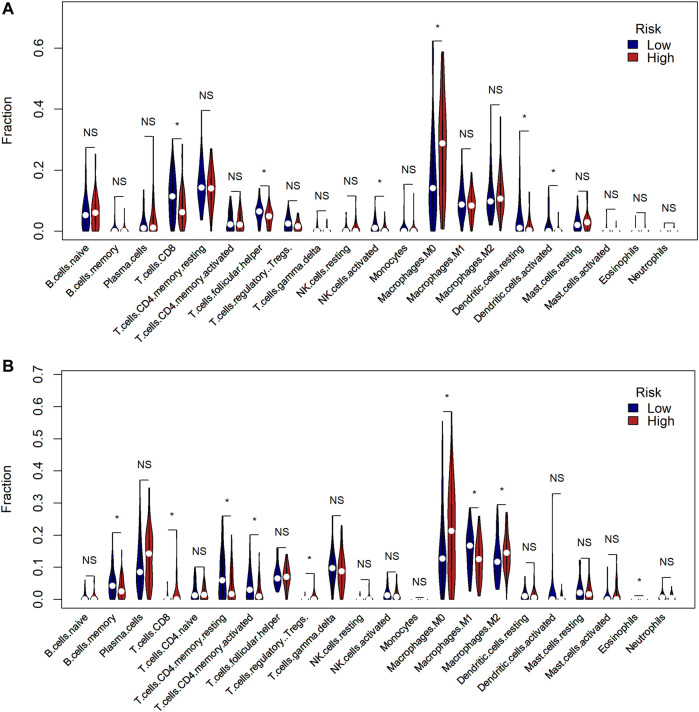
FIGURE 7.
Comparison of the tumor immune microenvironment between risk groups. (A) Comparison of the enrichment scores of 22 types of immune cells between low- (blue) and high-risk (red) groups in TCGA cohort (* means p < 0.05, NS means no significance). (B) Comparison of the enrichment scores of 22 types of immune cells between low- (blue) and high-risk (red) groups in the GEO cohort.

