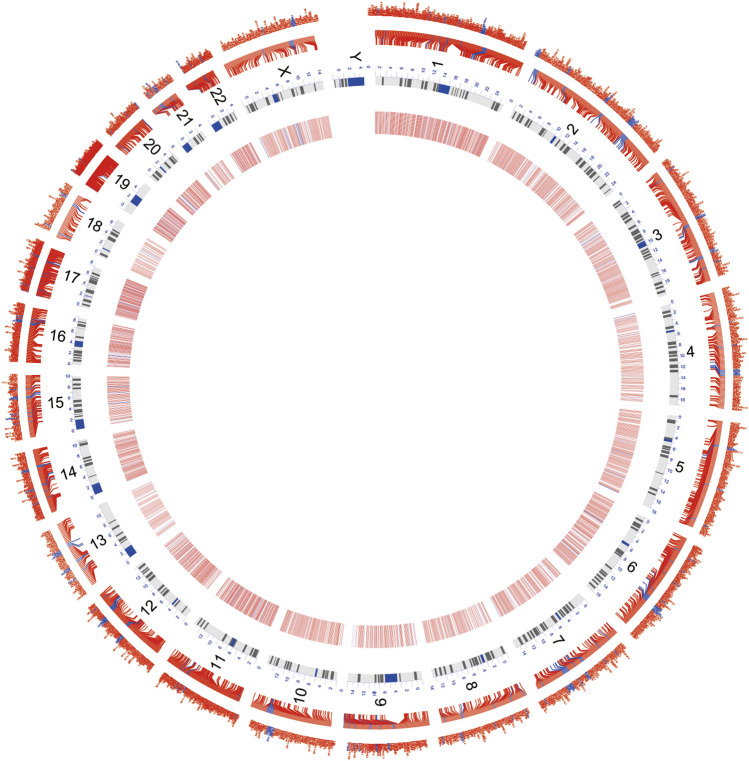
FIGURE 3.
Circos map demonstrates the distribution of DEmRNAs and DElncRNAs on the chromosome. Red characters and the transverse line in the outer layer denote DEmRNAs; blue characters and the transverse line in the inner layer denote DElncRNAs; the inner circle comprising red, white, and blue stripes is the heatmap for the differential expression. Red denotes the high expression, and blue denotes the low expression.

