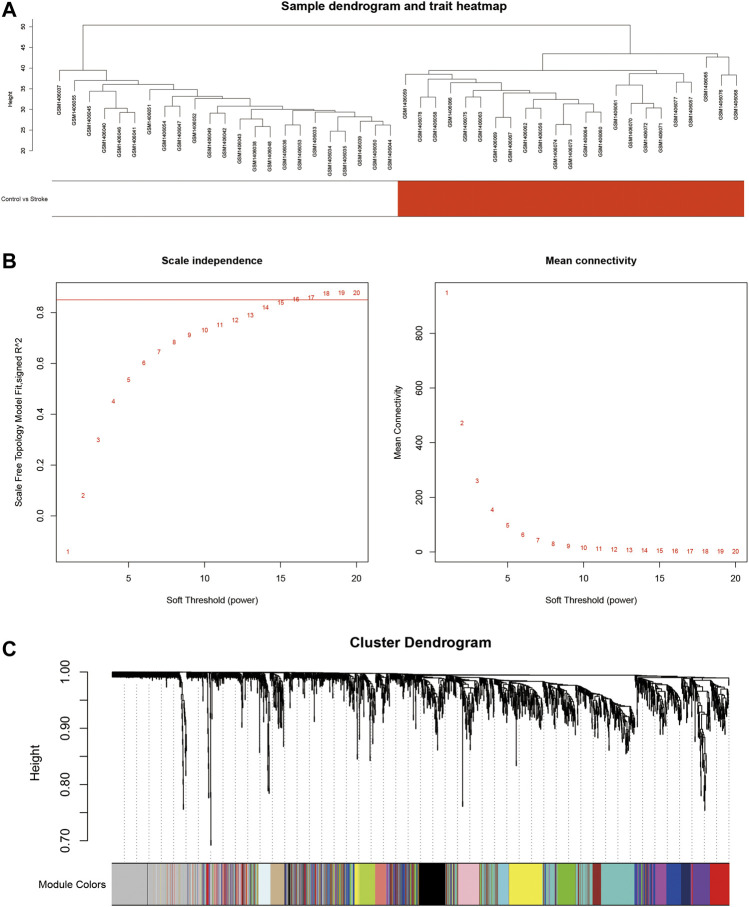
FIGURE 5.
Constructing the lncRNA and mRNA co-expression module using WGCNA. (A): Clustering analysis of 40 samples from GSE58794 based on the expression profiles of lncRNAs and mRNAs. White denotes the healthy control group, and red denotes the stroke group. (B): Network topological analysis targeting multiple soft thresholds. The soft threshold was set at 15. The red straight line denotes the boundary of the similarity as 0.85. (C): Clustering dendrogram of mRNAs and lncRNAs.

