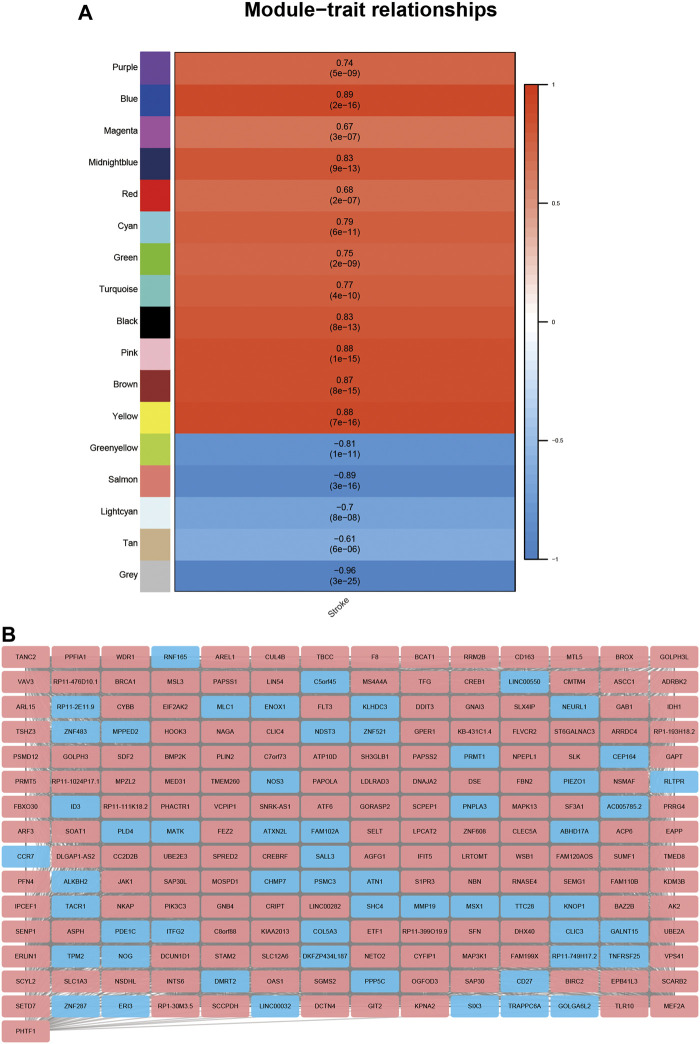
FIGURE 6.
Detection of gene modules closely related to stroke using WGCNA. (A): Correlation analysis on gene modules and clinical traits. Each row matches relative gene collection, and each column matched the relative clinical traits. The upper figure in the blank is the correlation coefficient, and the lower figure in the blank is the p value. (B): Co-expression network of lncRNAs and mRNAs in blue modules; red represents the upregulation of the gene, and blue represents the downregulation of the gene.

