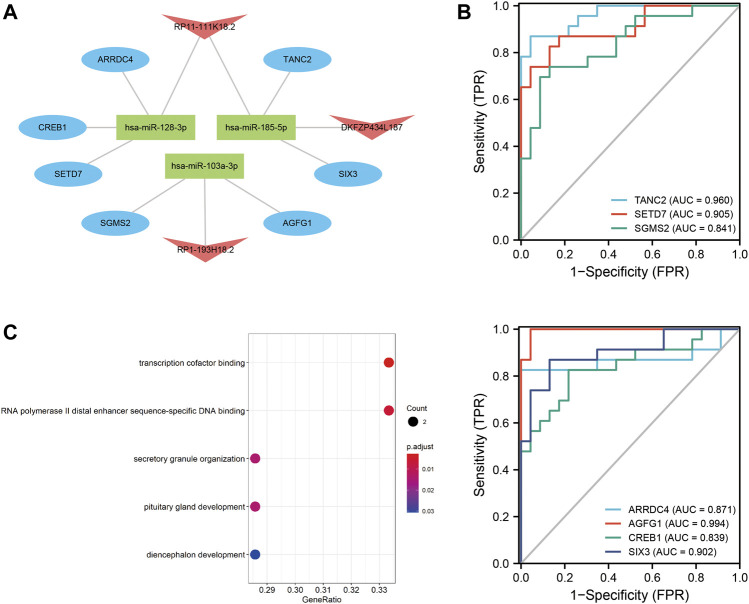
FIGURE 8.
ceRNA network and diagnostic ROC curve for mRNAs and GO enrichment analysis. (A): ceRNA network. Blue ovals denote mRNAs; red arrows denote lncRNAs; and green rectangles denote miRNAs. (B): Diagnostic ROC curve of seven mRNAs in the ceRNA network. (C): Summary of GO functional enrichment analysis on mRNAs.

