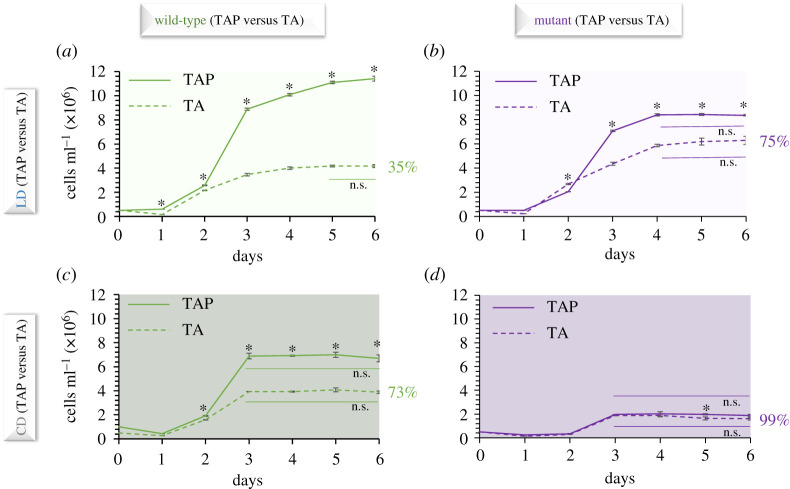
Figure 3.
Comparisons between the responses to phosphate-deprivation in a LD regime (a,b) and in CD (c,d) of the C. reinhardtii wild-type (a,c) and RLS1 mutant (b,d). Solid and dashed lines indicate phosphate-replete (TAP) and phosphate-depleted (TA) media, respectively. Error bars represent 2xSE (three biological replicates); asterisks denote significant differences p < 0.0001 between the two strains at each corresponding time point. Straight lines below growth curves indicate time periods characterized by non-significant (ns) growth (i.e. stationary phase) for each strain. Percentages indicate the final population size grown in phosphate-deplete relative to phosphate-replete media. (Online version in colour.)

