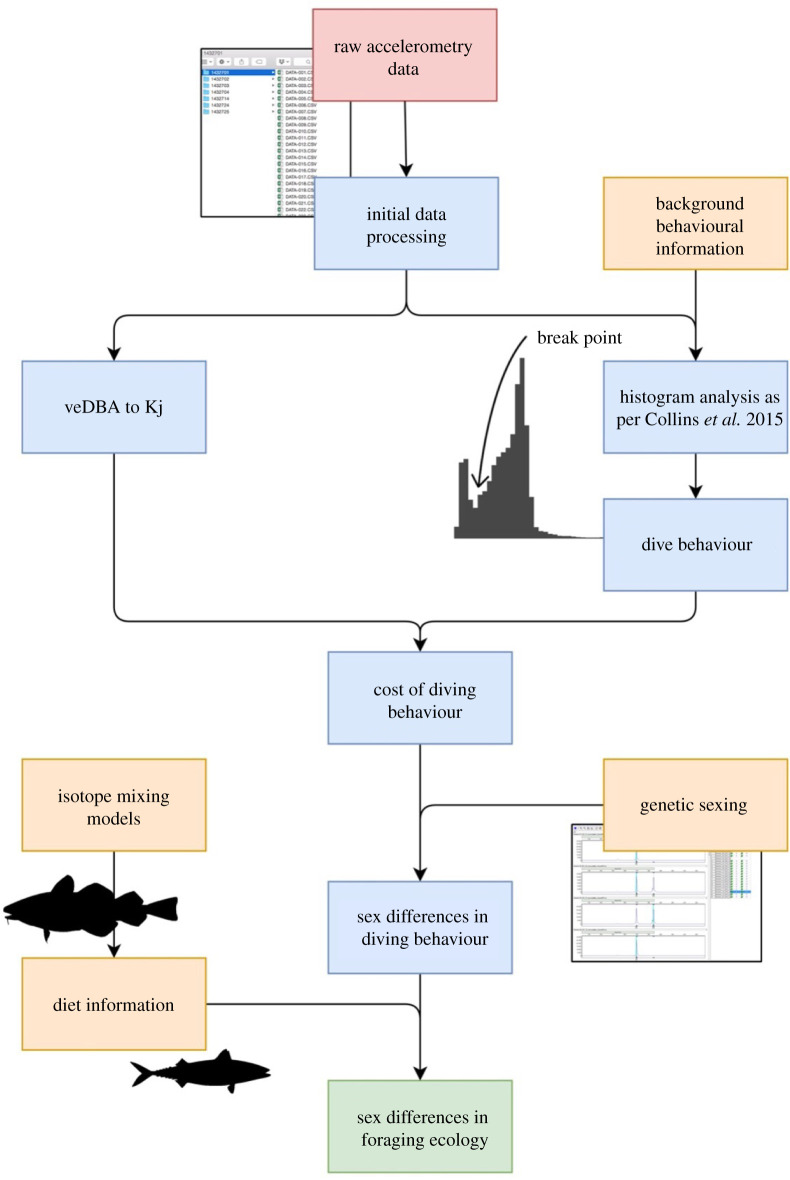
Figure 1.
Conceptual diagram of a methodology for data processing and the steps required to explore the sex differences in the foraging of northern gannets. The process starts at top with the red box labelled ‘raw accelerometry data’ and ends with the green box ‘sex differences in foraging ecology’. Blue boxes represent the methodology for analysing data and orange boxes represent additional analysis.

