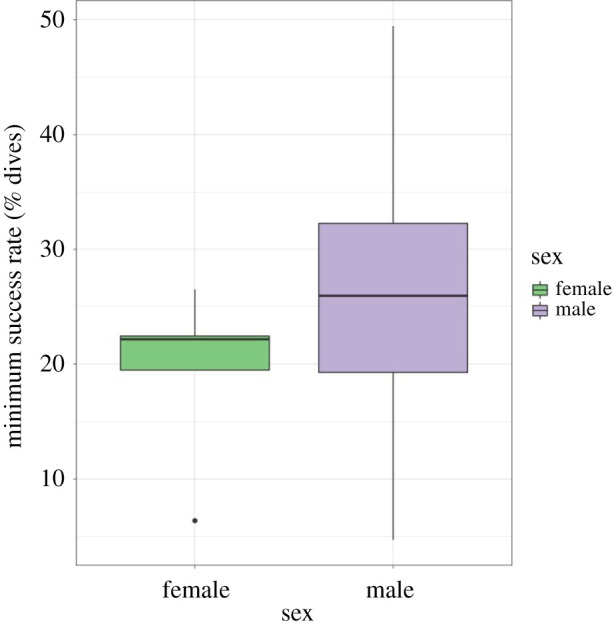
Figure 3.

Minimum feeding success rates between the sexes to maintain body mass and provision a chick. Males were predicted to require a higher feeding success rate due to the lower numbers of dives undertaken. The middle horizontal line of the boxplot represents the median of the data range, boxes represent the 25th and 75th percentile with lines showing the remaining range of data (with outliers shown as dots).
