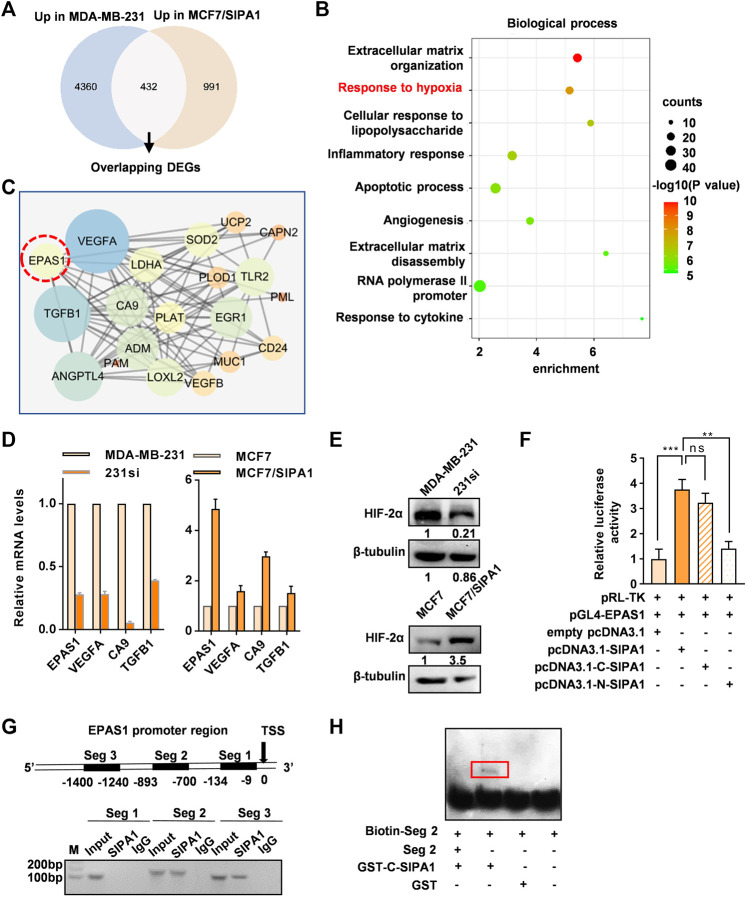
FIGURE 3.
SIPA1 upregulates EPAS1 transcription by binding to its promoter region. (A) Transcriptome sequencing datasets of two pairs of cells (MDA-MB-231 vs 231si, MCF7 vs MCF7/SIPA1) were analyzed and 432 overlapping candidate genes which were positively regulated by SIPA1 were selected in the Venn diagram. (B) GO biological process enrichment analyses of the 432 genes positively correlated with SIPA1. Top nine GO terms were listed with p values, counts and enrichment scores. (C) Genes allocated to “responses to hypoxia” in (B) were plotted as a protein-protein interaction network. (D) qRT-PCR analyses of EPAS1 and its downstream gene candidates, TGFB1, VEGFA and CA9. Data were shown as mean ± s.d. The experiments were conducted in triplicate. SDHC was included as an endogenous control. (E) Western blotting analyses of HIF-2α expression in breast cancer cells with various SIPA1 levels. β-tubulin was included as an internal control. (F) The effect of SIPA1 on EPAS1 promoter activity were accessed by a luciferase reporter assay. (G) Interaction of SIPA1 with EPAS1 gene promoter revealed by ChIP-PCR. Seg 1, Seg 2 and Seg 3 represented the indicated promoter regions. TSS, transcription start site. (H) Interactions of truncated SIPA1 protein (540-1042aa) with EPAS1 gene promoter segment 2 were revealed by EMSA. Data shown are mean ± s.d. of triplicate measurements (n = 3).

