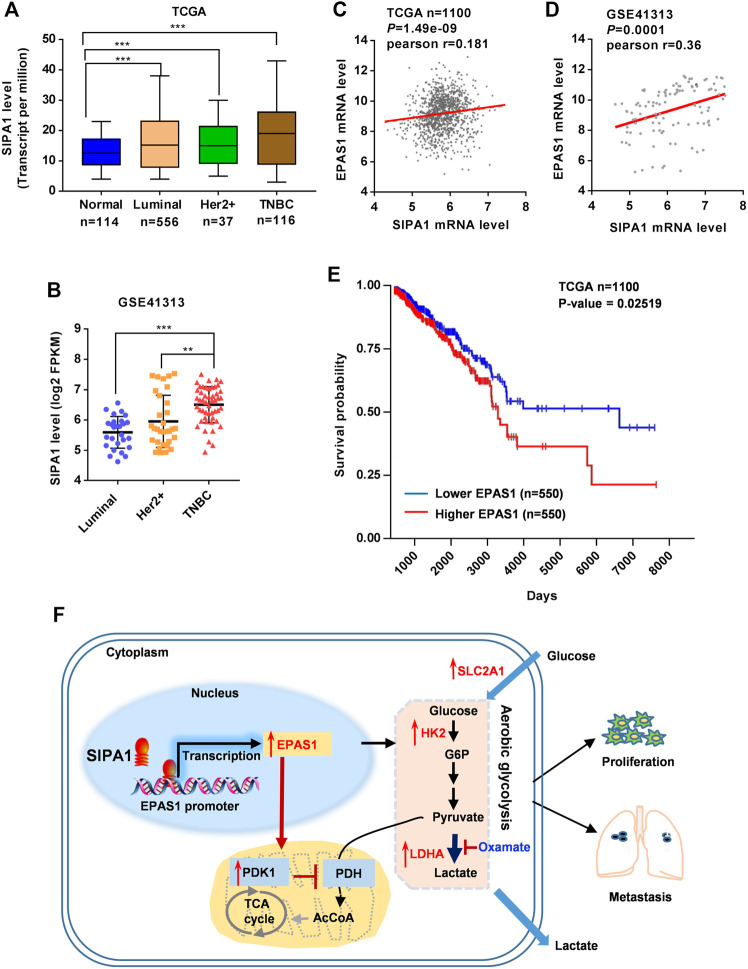
FIGURE 6.
SIPA1/EPAS1 axis is a poor prognosis predictor of breast cancer. (A–B) mRNA level of SIPA1 in breast cancer subtypes in TCGA (A) and GSE41313 dataset (B). (C–D) The relationship between SIPA1 and EPAS1 was analyzed based on TCGA (C) and GSE41313 datasets (D). Pearson correlation coefficients (Pr) for SIPA1 and EPAS1 gene expression levels were shown. (E) Kaplan-Meier survival analysis for survival probability of breast cancer patient in TCGA according to EPAS1 expression status. The p value was presented using the log-rank test. (F) A proposed diagram for SIPA1-mediated aerobic glycolysis and breast cancer cell metastasis.

