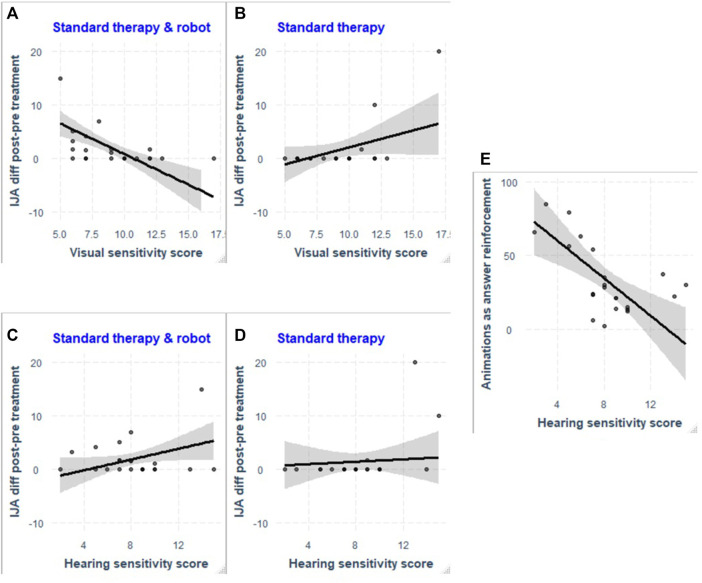
FIGURE 3.
Scatter plot of the difference in scores in the initiating joint attention item of the ESCS as a function of the participants visual sensitivity score, during Standard therapy and robot condition (A) and Standard therapy (B); and as a function of the participants’ hearing sensitivity score, during Standard therapy and robot condition (C) and Standard therapy (D). The visual and hearing sensitivity scores significantly predicted the improvement in Initiating Joint Attention during Standard therapy and robot condition [(A) and (C), respectively], but did not in the Standard therapy alone [(B) and (D), respectively]. In (E), the scatter plot of the number of animation played as a reinforcement to a correct or an incorrect answer in function of the hearing sensitivity of the participants.

