Figure 2.

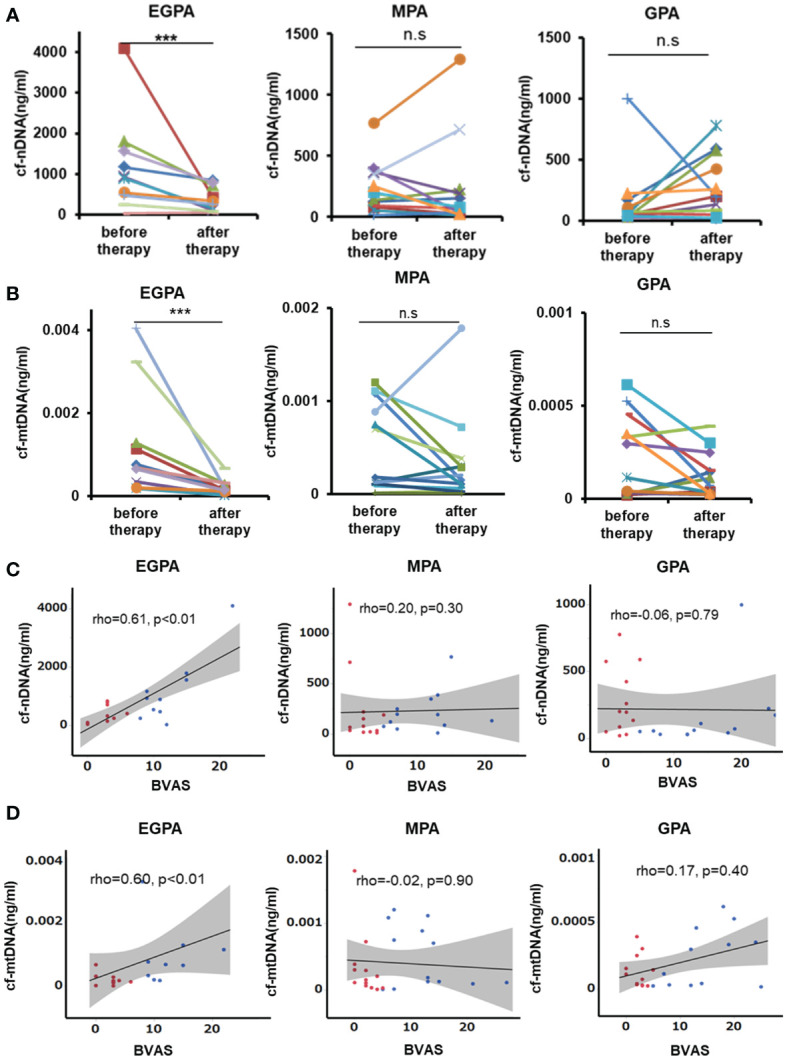
Serum cfDNA levels and disease activity in patients with AAV. (A) Concentrations of cf-nDNA and (B) cf-mtDNA in patients with EGPA, MPA, and GPA before and after immunosuppressive therapy. Same patients connected by lines. EGPA: n=10, MAP: n=13, GPA: n=12, ***P < 0.01, ns, not significant, Wilcoxon signed rank test. (C) Correlations between serum cf-nDNA and disease activity in patients with AAV. (D) Correlations between serum cf-mtDNA and disease activity in patients with AAV. A significant correlation was only observed in patients with EGPA. Blue dots: before treatment, red dots: after treatment, straight line: regression line, gray area: 95% confidence interval, Spearman’s rank correlation coefficient.
