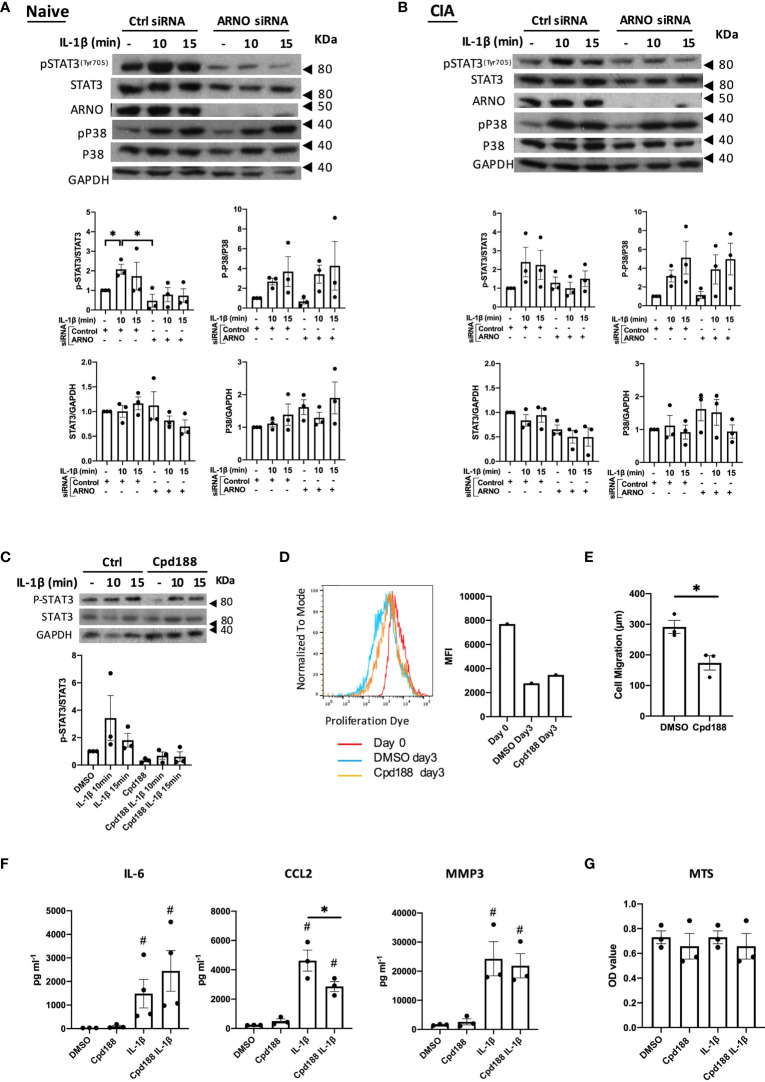
Figure 4.
ARNO is required for STAT3 phosphorylation in SFs. Representative Western blots of the naïve (A) and CIA (B) SFs treated with control and ARNO siRNA followed by IL-1β stimulation (10 ng/ml) at indicated times. Anti-pSTAT3Tyr705, STAT3, ARNO, p-p38, p38 and GAPDH antibodies were used. Graphs show the relative quantification of phosphorylated STAT3 and p38 in naïve SFs and CIA SFs, calculated as pSTAT3/STAT3 and p-p38/p38 band intensity, and changes in total protein expression were calculated as STAT3/GAPDH and p38/GAPDH. Error bars represent SEM (n=3). Each dot represents one independent experiment. *p < 0.05 by Mann-Whitney test. (C) Representative Western blots and quantification of phosphorylated and total STAT3 in control (DMSO) and Cpd188 (STAT3 inhibitor, 73uM) treated naïve SFs followed by IL-1β stimulation at indicated times (n=3). (D) Mean fluorescence intensity of proliferation dye in SFs cultured for 3 days after treated with Cpd188 compared to control SFs. (E) Migration distance of SFs was measured 24 hours after Cpd188 treatment, error bars represent SEM (n=3). *p < 0.05. (F) Control or Cpd188-treated SFs were stimulated by IL-1β (24h), when cell supernatants were collected to analyse cytokine secretion by ELISA. #p < 0.05 versus unstimulated control, statistical significance was evaluated by the Mann-Whitney test. (G) cell viability was assessed using MTS cell proliferation kit. In all cases, one dot represents one individual experiment, analysed in triplicate for ELISA and MTS assays.

