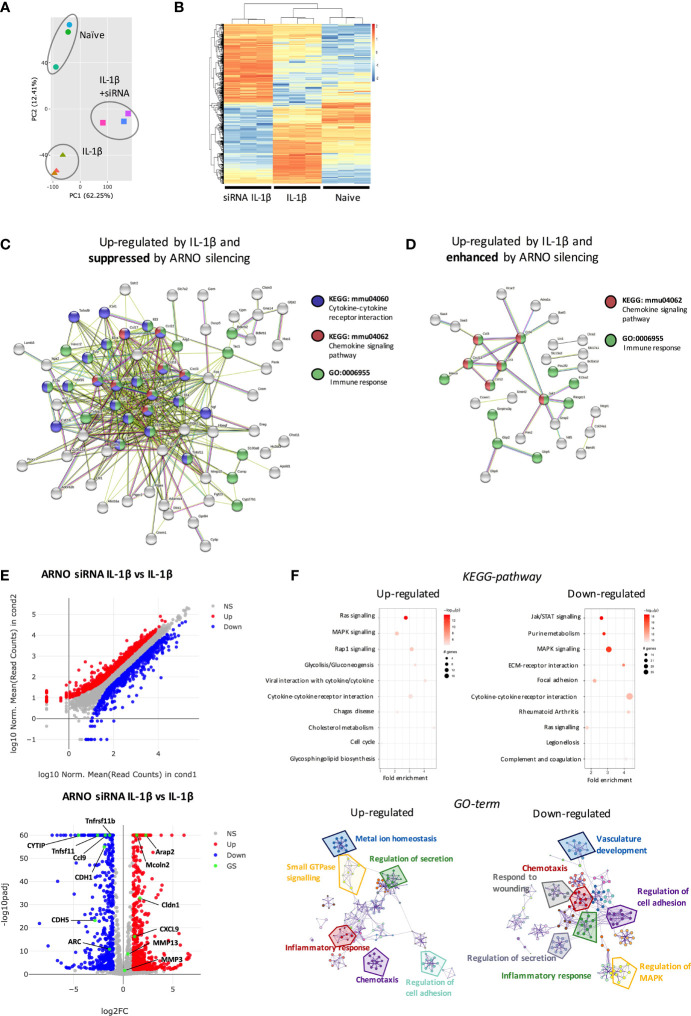
Figure 5.
ARNO knocked-down SFs show a distinct transcriptomic profile in response to IL-1β stimulation. (A) RNA was isolated (RIN>9) from naïve, IL-1β stimulated and IL-1β stimulated ARNO knocked down SFs (6 hours, n=3) and subjected to bulk RNA-Seq (75bp paired-end, 30M reads). Principal component analysis (PCA) is shown. (B) Differential expression (DE) of genes amongst the three experimental groups. Genes were considered significant if they passed a threshold of padj < 0.01 and |log2foldChange| > 4 among any paired comparison. DE genes were then subjected to unsupervised hierarchical clustering and represented as Z scores. (C,D) Function enrichment and network analysis regulated by IL-1β and ARNO expression. STRING protein-protein interaction network (https://string-db.org) was performed on DE genes from (B), with genes up-regulated only in the IL-1β-treated group (C) or genes up-regulated only in the ARNO siRNA group (D). Significantly modulated pathways components associated with ARNO silencing upon IL-1β are shown. (E) DE of genes in IL-1β stimulated SFs compared to ARNO siRNA IL-1β SFs. Genes are plotted as a scatter plot where x= gene expression in IL-1β SFs, y=gene expression in siRNA ARNO IL-1β SFs. Volcano plot shows gene expression versus p value for each gene. Genes that pass a threshold of padj < 0.01 and |foldChange| > 2 in DE analysis are colored in blue when they are down regulated and red when they are upregulated in IL-1β treated cells. (F) DE genes identified in (E) were used to conduct KEGG pathway enrichment analysis and GO-term pathway analysis. KEGG pathways are represented by circles and are plotted according to fold enrichment on the x-axis and -log10 p-value on the coloured scale. The size is proportional to the number of DE genes. Metascape enrichment network diagrams illustrate GO-term pathways significantly enriched for top up-regulated and down-regulated genes.

