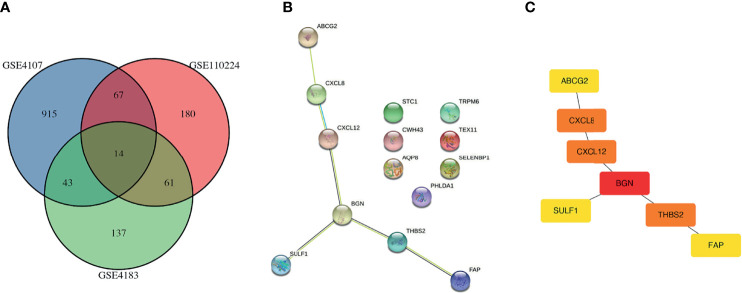
Figure 1.
Identification of overlapping DEGs. (A) Venn plots of overlapping DEGs in GSE4107 dataset, GSE110224 dataset and GSE4183 dataset. (B) PPI of 14 DEGs using the STRING database (https://string-db.org). (C) PPI network of DEGs were constructed and visualized by Cytoscape software. PPI, protein-protein interaction; DEG, differentially expressed gene.

