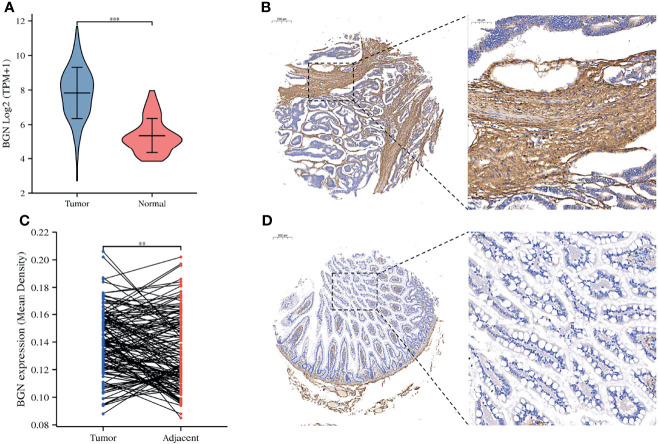
Figure 2.
The expression levels of BGN were significantly upregulated in patients with colon cancer. (A) The mRNA expression of BGN in the normal and tumor samples in TCGA. Data are represented as the mean ± SD. The Y-axis represents log2 (TPM+1) transformed RNA seq expression data. Wilcoxon rank sum test served as the statistical significance test. (B, D) Immunohistochemistry staining of example colon cancer patients with positive BGN staining in tumor tissues and the negative BGN staining in adjacent tissues. (C) Paired differentiation analysis for mean density of BGNs detected by immunohistochemistry staining sin tumor and paired adjacent tissues deriving from tumor microarray. The Wilcoxon signed rank test was used for comparison. Significant differences referred ass: **p < 0.01, ***p < 0.001.

