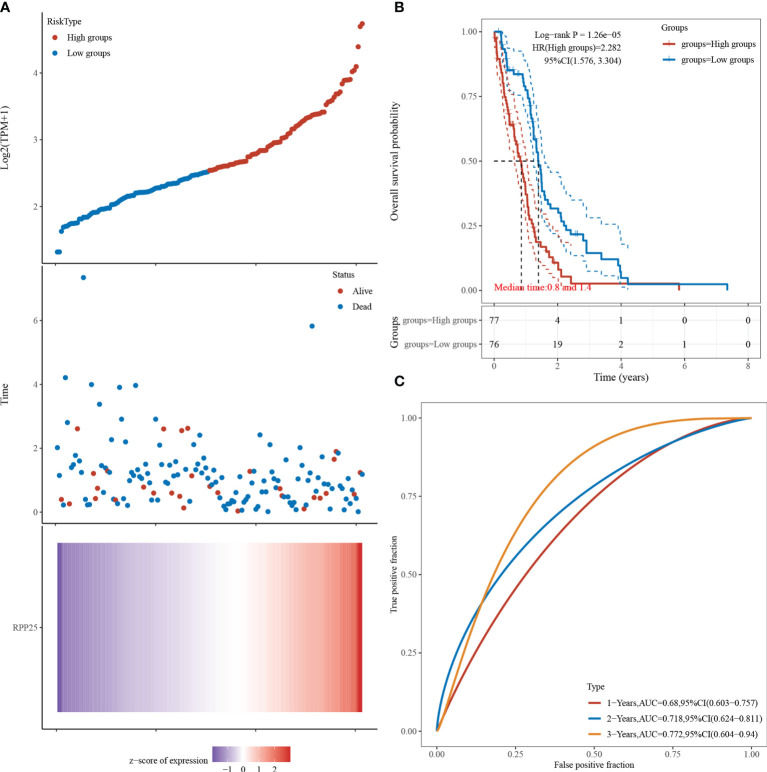
Figure 5.
RPP25 expression and GBM survival analysis; (A) RPP25 expression versus survival time and survival status in GBM patients from TCGA datasets; (B) KM survival curve distribution of RPP25 expression in TCGA dataset visualized by R packages survival and survminer; (C) ROC curve and AUC of RPP25 at different times.

