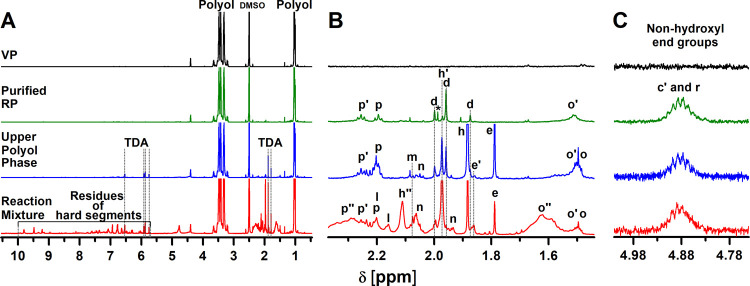
Figure 3.
(A) Magnified 1H NMR spectra of the crude reaction mixture obtained after PUF acidolysis with AA at 220 °C for 30 min and a molar ratio of the AA/urethane group of 1.1, the isolated upper polyol phase after centrifugation of the crude reaction mixture, and the purified RP and VP of the same type, recorded in DMSO-d6, together with the (B) magnified region typical for the quantification of the nonhydroxyl end groups of the polyol. (C) Magnified region of the 1H NMR spectra (normalized to the polyol methyl group) of the same samples recorded in DMSO-d6 with added TFA, showing the overlapping signals of the polyol methyne group near the urethane and ester bonds. The peak assignment refers to the structures shown in Table S4.

