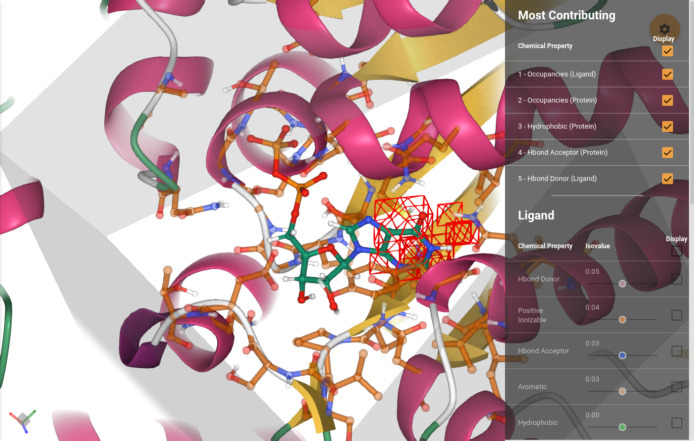
Figure 1.
Main view of the graphical user interface. The protein–ligand complex is displayed, with the attributions of the most contributing voxels superimposed. The attributions for the different channels can be seen individually using the corresponding sliders in the menu on the right, which display isosurfaces at different isovalues. The full protein is shown in a cartoon representation, while residues in the binding site (defined by being within 5 Å to the ligand) are shown in a transparent ball–stick representation (only heavy atoms and polar hydrogens). The all-atom representation of the ligand is shown in a bold ball–stick. The region of space seen by the model (voxelization cube) is delimited by a transparent, gray box.

