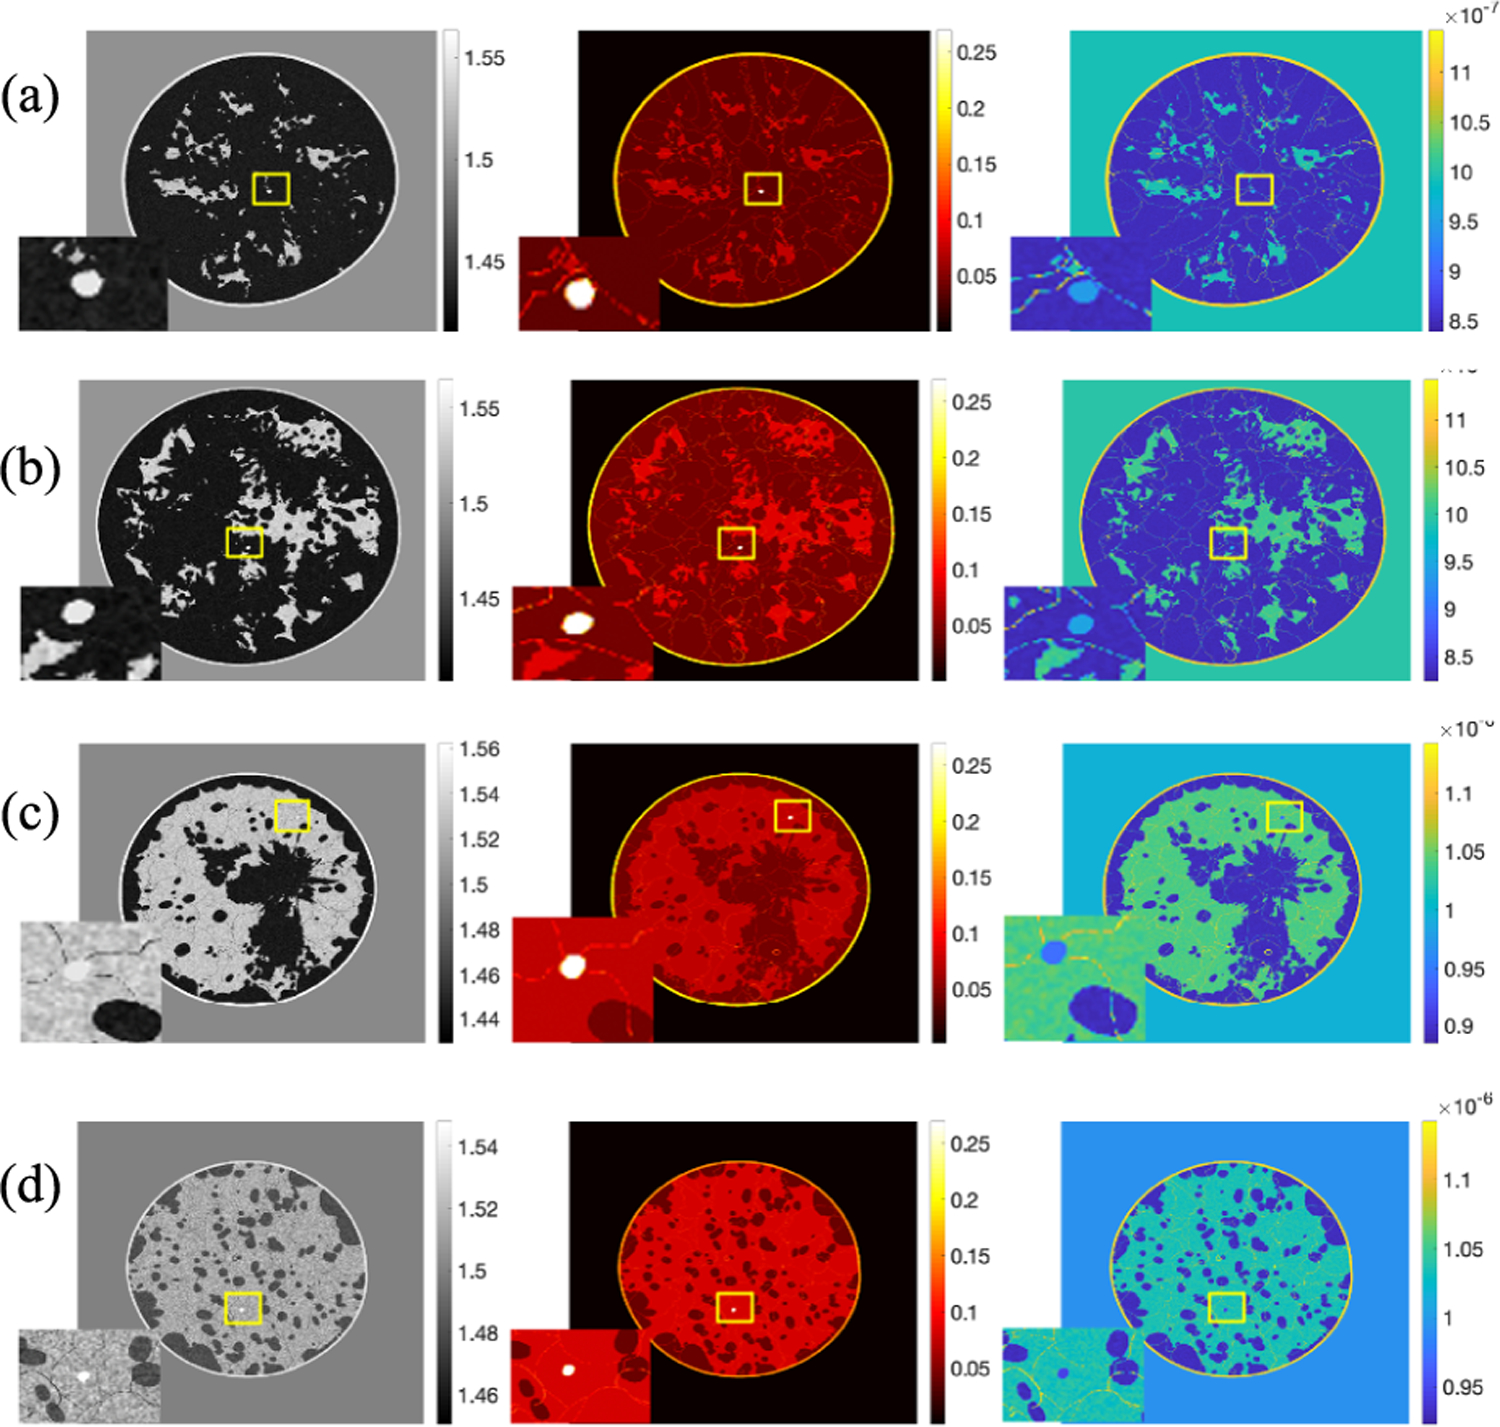
Fig. 7.

Realization of a cross-sectional slice from four types breast. From left to right: the SOS (mm/μs) image, AA (Np/m/MHzy) image, and density (kg/m3) image. Tumor region is zoomed in. From up to bottom: (a) almost entirely fatty, (b) scattered areas of fibroglandular density, (c) heterogeneously dense, and (d) extremely dense.
