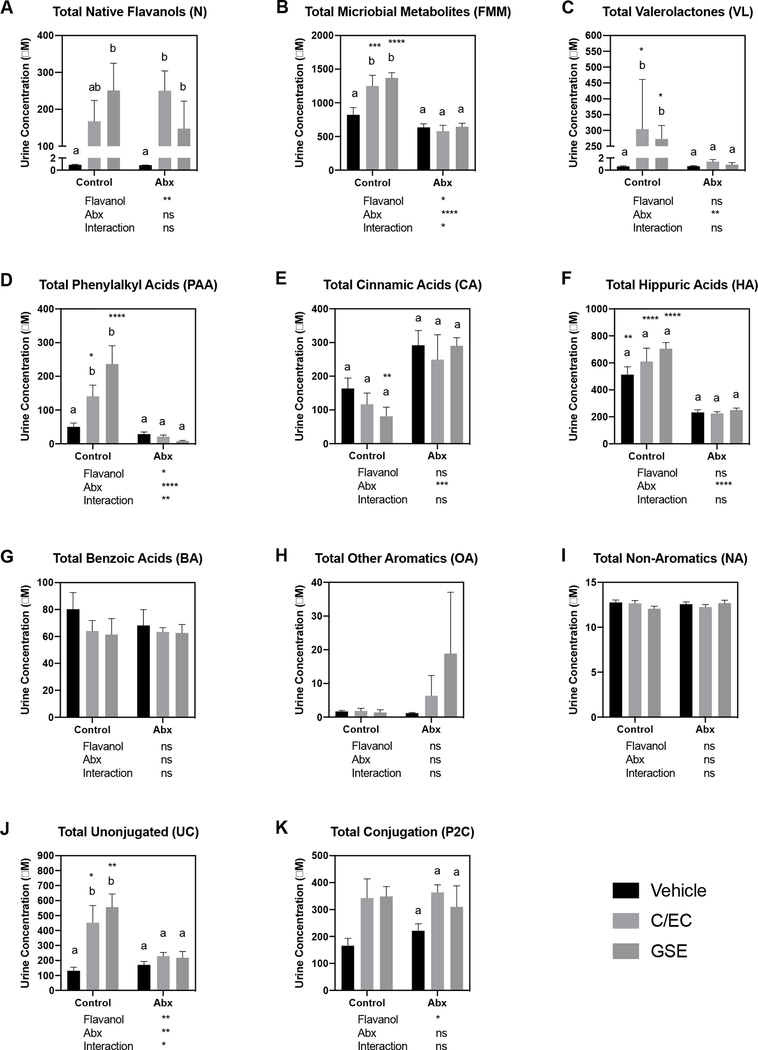
Figure 2.
Concentrations of total levels of native flavanols, flavanol microbial metabolites, and their phase-II conjugates in urine samples. Values are presented as mean ± SEM. For each measure, 2-way ANOVA was performed to determine the statistical significance of main effects (flavanol and Abx treatment) and interactions. Values below each graph indicate the results of 2-way ANOVA. If a significant main effect or interaction was detected, Holm-Sidak post hoc tests to account for multiple comparisons were performed to determine differences among the 3 flavanol treatments within each antibiotic treatment group (Control and Abx); bars not sharing a common superscript letter within each group are statistically different. Holm-Sidak post hoc tests were also performed to determine differences between antibiotic treatments (Control and Abx) for each flavanol; asterisks indicate a significant difference for that flavanol between Control and Abx (*P<0.05, **P<0.01, ***P<0.001, ****P<0.0001). The overall family-wise error rate was set as 0.05, with one family per group.

