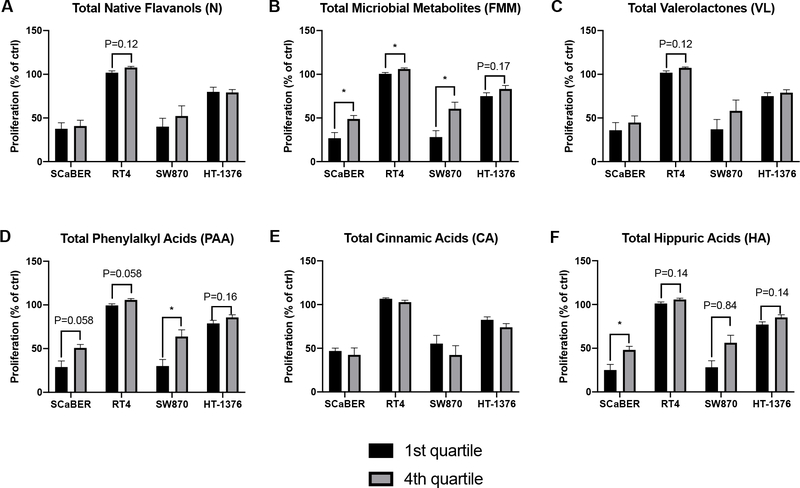
Figure 5.
Comparison of proliferation between urine samples with the highest and lowest quartiles of concentrations of various classes of compounds. Values are presented as mean ± SEM. Within each compound class, proliferation was compared between the highest vs. lowest quartiles by t-tests, with the Holm-Sidak method to control for multiple comparisons (1 family per compound class, 4 t-tests: 1 per cell line). For all tests: *P<0.05, **P<0.01, ***P<0.001, ****P<0.0001.

