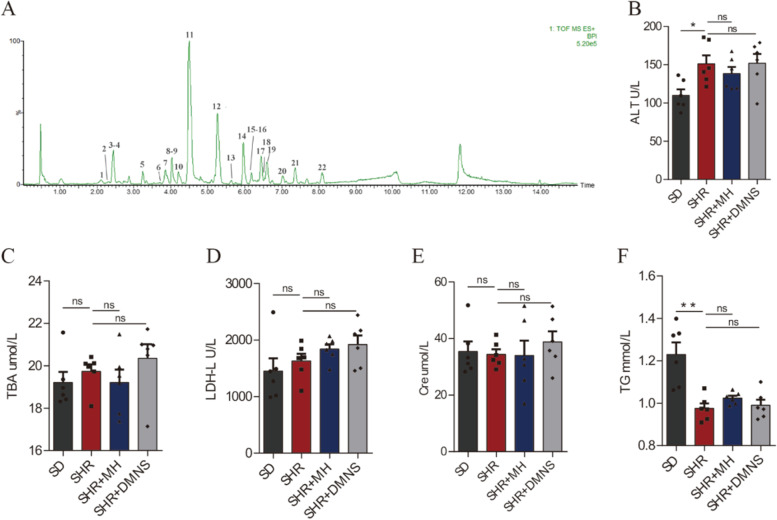
Fig. 1.
Preliminary characterization of DMNS and the blood biochemical test results of rats in each group. A Mass spectrum of the positive ion peak of DMNS. The numbers in the figure indicate the identified compounds, and the specific information is shown in Table S2. B ALT level in rat serum. C TBA level in rat serum. D LDH-L level in rat serum. E Cre level in rat serum. F TG level in rat serum. One-way analysis of variance (ANOVA) with Tukey’s statistical method. The data were presented as means ± standard error of the mean (SEM) for each group of rats (n = 6); *P < 0.05, **P < 0.01

