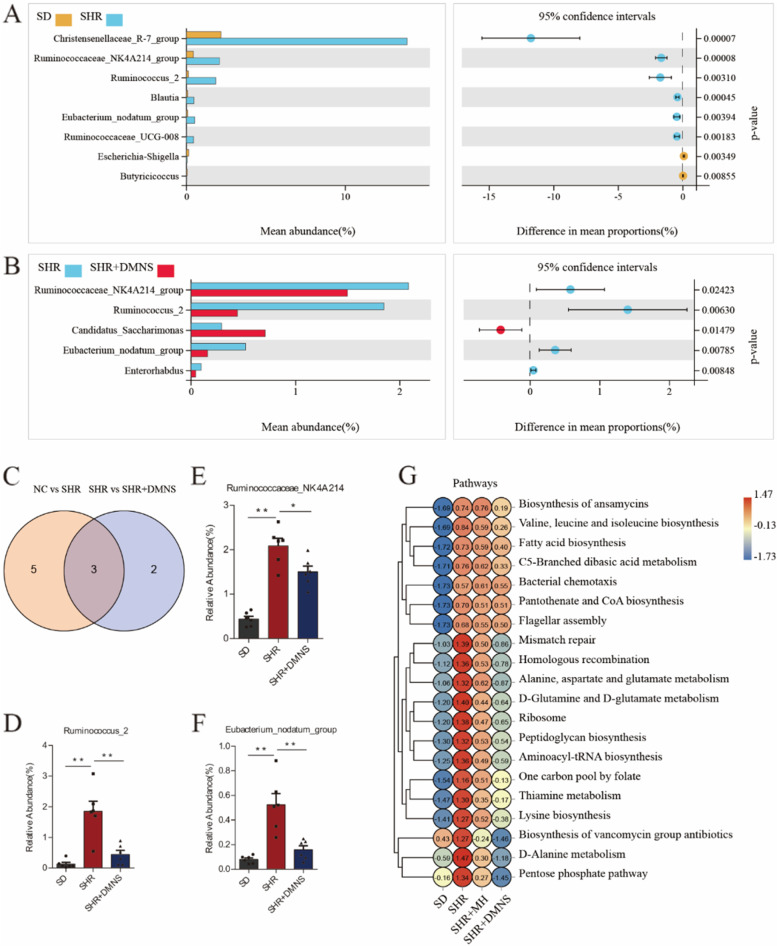
Fig. 4.
Differences in the gut microbiota between groups. A Microbiotas of SD rats vs. SHRs at the genus level (Welch’s t test). B Microbiotas of SHRs vs. SHRs+DMNS at the genus level (Welch’s t test). C Venn diagram of the different microbiotas after pairwise comparison. D-F Histograms of Ruminococcaceae_NK4A214_group, Ruminococcus_2 and Eubacterium_nodatum_group (Tukey test). G Pathways heatmap. The vertical axis indicates the classification of pathways, the horizontal axis indicates the group, and the color indicates the level of abundance. The data are presented as means ± SEM for each group of rats (n = 6); *P < 0.05, **P < 0.01

