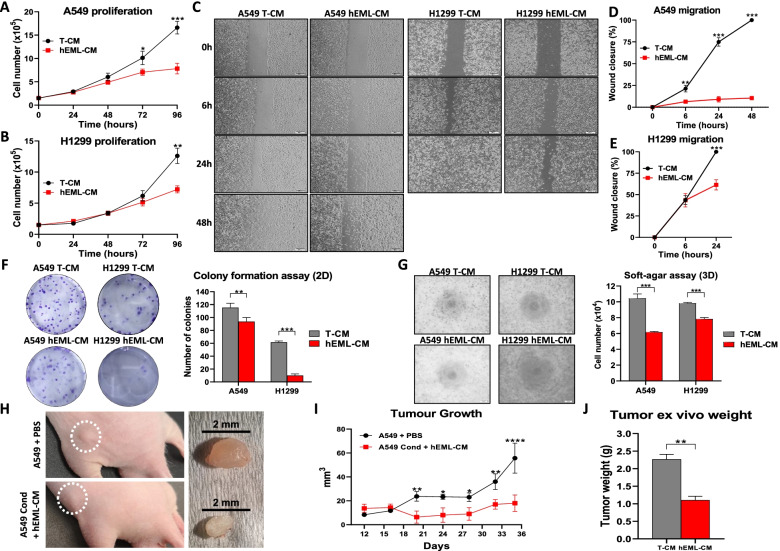
Fig. 3.
Functional in vitro and in vivo analysis of lung cancer cells cultured in T-CM and in hEML-CM. a, b Proliferation of A549 and H1299 cells after 96 h in T-CM and hEML-CM. Error bars represent the standard deviation of three replicates. c Wound healing assay in the A549 and H1299 cell lines. Cells were grown to confluence, wounded and grown in T-CM and hEML-CM, and photographed at 0, 6, 24 and 48 h. d, e Calculated wound healing areas in A549 and H1299 cells cultured in T-CM and hEML-CM. Data represent the mean ± SEM from at least three separate experiments at 0 h, 6 h, 24 h and 48 h. f Colony formation assay (2D) in the A549 and H1299 cell line. A representative image is shown in the left and the quantification of the colony number for each condition is shown in the right. Data represent the mean ± SEM from six separate experiments. g Soft-agar assay (3D) in the A549 and H1299 cell lines. A representative image is shown in the left and the quantification of cell number for each condition is shown in the right. h Representative image of 5-week-old male athymic nude mice (Rj:ATHYM-Foxn1nu/nu) with control or conditioned A549 cells injected in the flank at day 35 and resected tumors from each animal. i Graph showing the mean tumor volume of 3 biological replicates measured by a caliper every 4 days in both conditions. j Mean tumor weights in each condition at day 35. All data represent the mean ± SEM. *p < 0.05; **p < 0.01; ***p < 0.001; ****p < 0.0001

