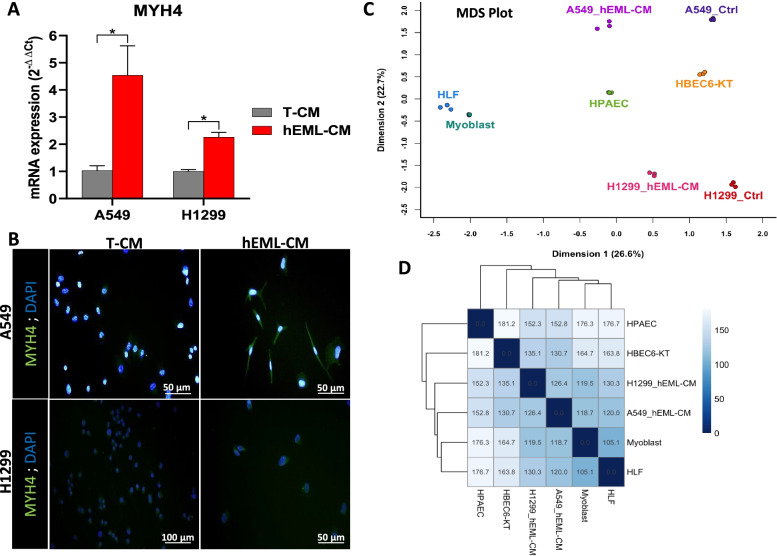
Fig. 6.
Evaluation of myofibroblastic differentiation of hEML-CM cells. a Upregulation of MYH4 mRNA in A549 and H1299 cells cultured in hEML-CM compared to those cultured in T-CM. Data represent the mean ± SEM from three separate experiments. b Immunofluorescence detection of MYH4 in A549 and H1299 cells cultured in T-CM and hEML-CM. In hEML-CM, the A549 cells showed highly positive staining, while the staining in H1299 cells was less intense. No staining was detected in cells cultured in T-CM. Nuclei were counterstained with DAPI. c Multidimensional Scaling plot of distances between gene expression profiles for A549_hEML-CM, A549_Ctrl, H1299_hEML-CM, H1299_Ctrl, HBEC6-KT, HPAEC, Myoblast and HLF samples. Three samples of each group have been included in the analysis. d Simplified distance matrix heat map showing the mean of the three replicates for each group. *p < 0.05

