Fig. 4.
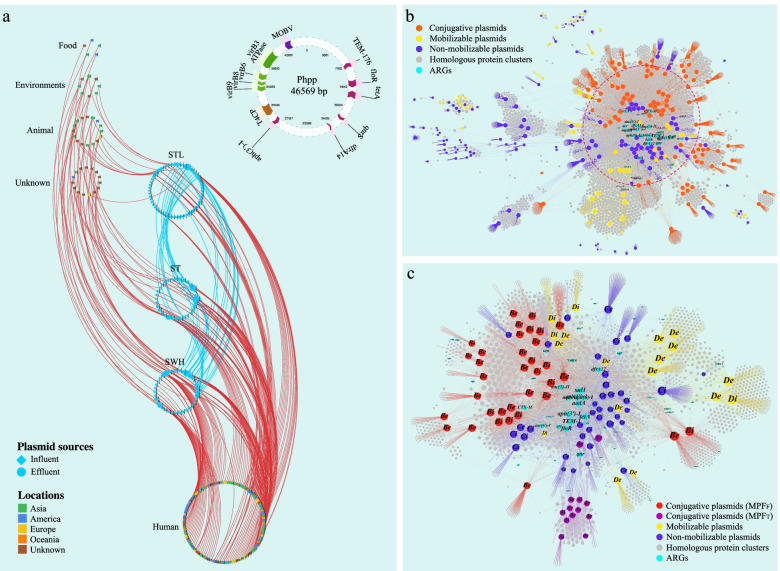
Network diagram depicting the global dissemination of WWTP plasmids. a Each node represents a plasmid, with different colors showing geographical locations of the plasmids. The curved lines represent the plasmids that are shared between different isolation sources. A representative MDR conjugative plasmid that may be transferred between different bacterial genus (Escherichia and Salmonella) across geographical and ecological barriers (i.e., detected in three Hong Kong WWTPs and a wet market in Singapore) is shown in the upper right. b Bipartite network of horizontal gene transfer among all plasmids (conjugative: 89; mobilizable: 45; non-mobilizable: 130). The location of the plasmids in this figure is determined using ForceAtlas2 as the layout algorithm by connecting the genomic units (i.e., plasmids) and homologous protein clusters (HpCs). This layout arranges the plasmids by the set of shared proteins among these plasmids and the broad-range determinants tend to lie in the center of the network. The shared ARGs are highlighted in vivid cyan, and different categories of plasmids are indicated. c Bipartite network of horizontal gene transfer among all ARG-bearing plasmids (conjugative: 48; mobilizable: 18; non-mobilizable: 38). The node color and the capital letter in each node represents the plasmid type (i.e., A: conjugative MPFT; B: conjugative MPFF; C: non-mobilizable; D: mobilizable), and the lowercase letter indicates the isolation source of the corresponding plasmid (i.e., i: influent; e: effluent)

