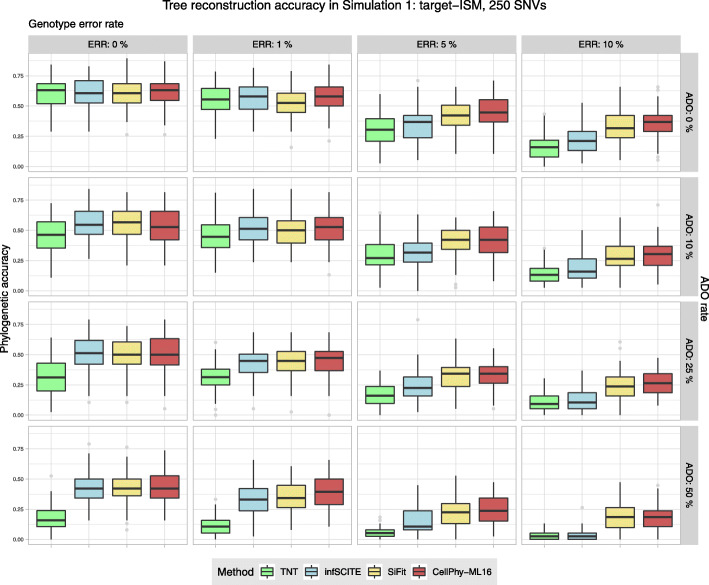
Fig. 1.
Phylogenetic accuracy in simulation 1 (“target-ISM”) with 250 SNVs. Datasets consisted of 40 cells. Accuracy was evaluated under different levels of genotype error (ERR), allele dropout (ADO), and genotype recoding strategy “missing.” Phylogenetic accuracy is 1—nRF (see the “Methods” section). Boxplots were generated with the ggplot2 R package [58] (https://ggplot2.tidyverse.org) with default parameters. Lower and upper hinges correspond to the first and third quartiles. The upper whisker extends from the hinge to the largest value no further than 1.5 * IQR (IQR is the interquartile range or distance between the first and third quartiles). The lower whisker extends from the hinge to the smallest value at most 1.5 * IQR of the hinge. Data points beyond the end of the whiskers are called “outlier” points and plotted individually

