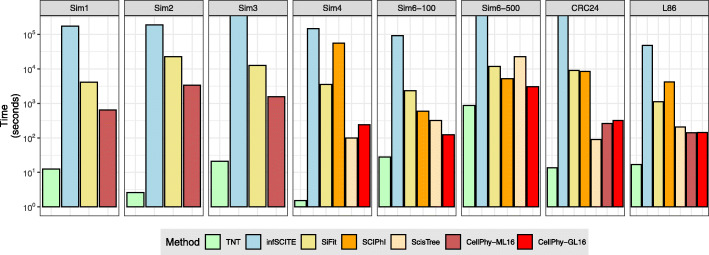
Fig. 5.
Speed comparisons for simulated and real datasets. “Sim1” corresponds to a simulated single-cell dataset with 40 cells and 4753 SNVs. “Sim2” corresponds to a simulated dataset with 100 cells and 9935 SNVs. “Sim3” corresponds to a simulated dataset with 60 cells and 9982 SNVs. “Sim4” corresponds to a simulated dataset with 40 cells and 3986. “Sim6-100” corresponds to a simulated dataset with 100 cells and 1000 SNVs. “Sim6-500” corresponds to a simulated dataset with 500 cells and 1000 SNVs. CRC24 and L86 correspond to two empirical datasets (see the “Methods” section). Note the logarithmic time scale on the y-axis

