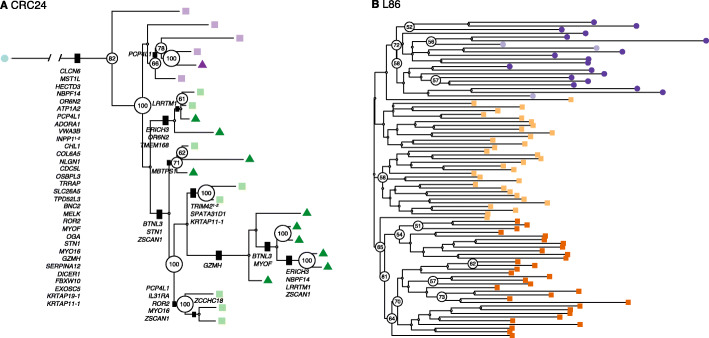
Fig. 6.
CellPhy tree for the CRC24 and L86 datasets. A “CellPhy-GL” CRC24 tree. Distinct shapes and colors represent cell type: healthy (blue circle); tumor-non-stem from the tumor inferior (TI) region (dark green triangle), tumor-stem from TI region (light green square), tumor-non-stem from the tumor middle (TM) region (dark purple triangle), and tumor-stem from the TM region (light purple square). Only bootstrap support values above 50 are shown. Non-synonymous mutations are displayed on internal branches. B “CellPhy-GL” L86 tree. Distinct shapes and colors represent cell type: healthy diploid cells—from both primary and metastatic sites—(dark purple circle), healthy diploid cells missorted (light purple circle), primary tumor aneuploid cells (light orange square), and metastatic aneuploid cells (dark orange square). Only bootstrap values above 50 are shown

