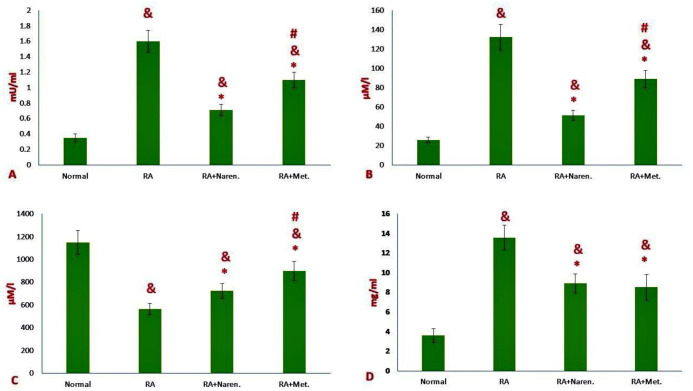
Figure 2.
Changes in the biochemical profiles of sera in RA rats. A) Myeloperoxidase activity (MPO), B) Nitric oxide (NO), C) total antioxidant capacity (TAC), and D) C-reactive protein (CRP). Data were reported as mean ±S. D. (&p<0.05 versus healthy rats, *p<0.05 versus PBS-treated RA rats; #p<0.05 versus methotrexate treated RA rats). (Naren. Naringenin-treated RA group; Met., methotrexate-treated RA group).

