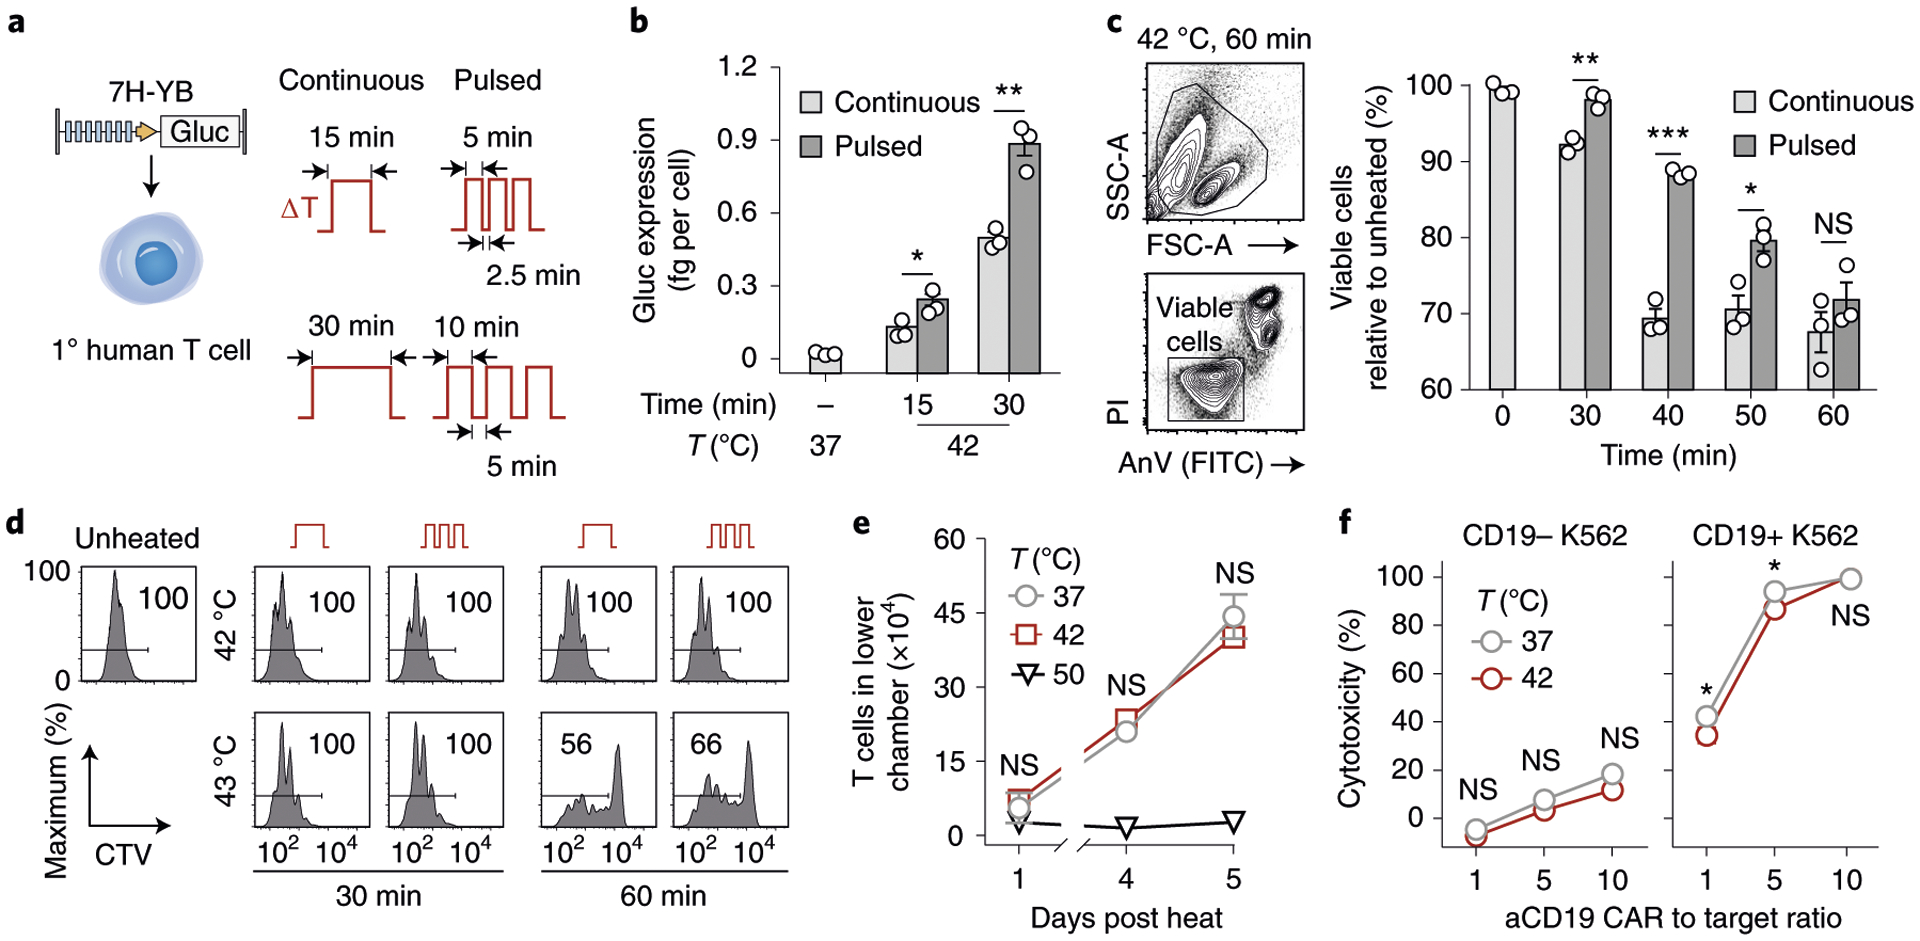
Fig. 2 |. Thermal treatments are well-tolerated by primary human T cells.

a, Schematic representation of transduced primary human T cells and thermal delivery profiles. b, Gluc activity of the 7H-YB thermal switch in primary human T cells after continuous (light grey) and pulsed (dark grey) heat treatments with temperatures, total durations and heating profiles as indicated. *P = 0.033; **P = 0.0021; two-tailed t-test; mean ± s.e.m. is depicted; n = 3 biologically independent wells. c, PI and AnV flow staining of CD3+ T cells. Bars represent viable populations (PI−AnV−) normalized to unheated samples. *P = 0.0455; **P = 0.0034; ****P < 0.0001; two-way ANOVA and Šidák post-test and correction; mean ± s.e.m. is depicted; n = 3 biologically independent wells; FSC-A, forward scatter area; SSC-A, side scatter area. Two independent experiments were performed with similar results. d, CellTrace Violet (CTV) flow histograms of T cells after heat treatments and incubation with CD3/28 beads at a 3:1 bead to T cell ratio. Values in histogram boxes represent percentage in indicated gate. Two independent experiments were performed with similar results. e, Number of cells in lower well of a transwell plate containing CXCL12. T cells were heated and loaded into the top well before sampling at indicated timepoints. Two-way ANOVA and Tukey post-test and correction; mean ± s.e.m. is depicted; n = 3 biologically independent wells. Two independent experiments were performed with similar results. f, Percent cytotoxicity observed in CD19− or CD19+ luciferized K562 cells after incubation with T cells constitutively expressing CARs after heating, with effector to target ratios as indicated. *P = 0.0166 at a 1:1 CAR T cell to target cell ratio; *P = 0.0251 at a 5:1 CAR T cell to target cell ratio; two-way ANOVA and Šidák post-test and correction; mean ± s.e.m. is depicted; n = 3 biologically independent wells. Two independent experiments were performed with similar results.
