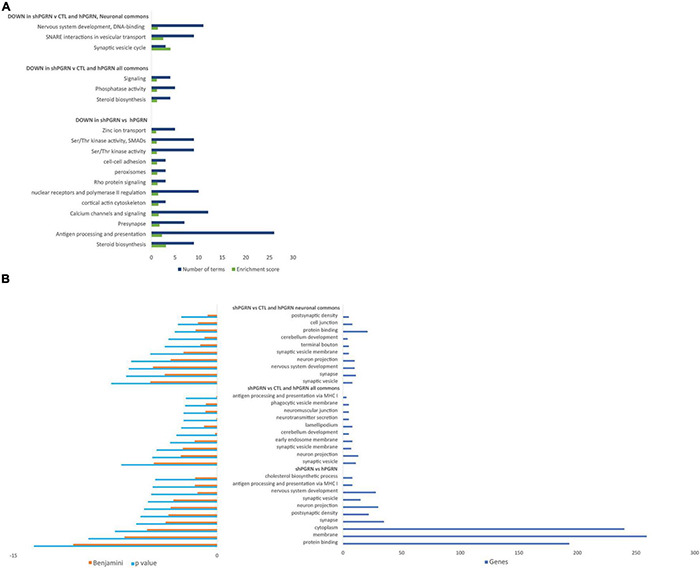
FIGURE 2.

Gene ontology enrichment analyses for molecular signals that are downregulated in cells with reduced PGRN expression (NSC-34/shPGRN cells). (A) Functional Annotation Clusters (DAVID) with an enrichment score of one or greater for molecules downregulated in PGRN knockdown cells (shPGRN) are compared against: (i) PGRN overexpressing cells (DOWN in shPGRN vs hPGRN); (ii) The molecules downregulated in NSC-34/shPGRN cells relative to both NSC-34/hPGRN cells and Control cells (DOWN in shPGRN v [CTL and hPGRN all commons]) and molecules in the common set that have well defined neuronal functions (DOWN in shPGRN v [CTL and PGRN, neuronal commons]). See the text for details. Both GO and KEGG terms were included in the analysis and the clusters named based on a summary of its individual GO and KEGG terms. (B) Top ten GO terms downregulated in PGRN knockdown cells (shPGRN) versus groups (i–iii) as above. Statistical terms are expressed as -log10 and ranked by their p scores, and are shown together with their Benjamini scores, which take account of potential false discovery rates. The number of genes included in each GO term is given on the right.
