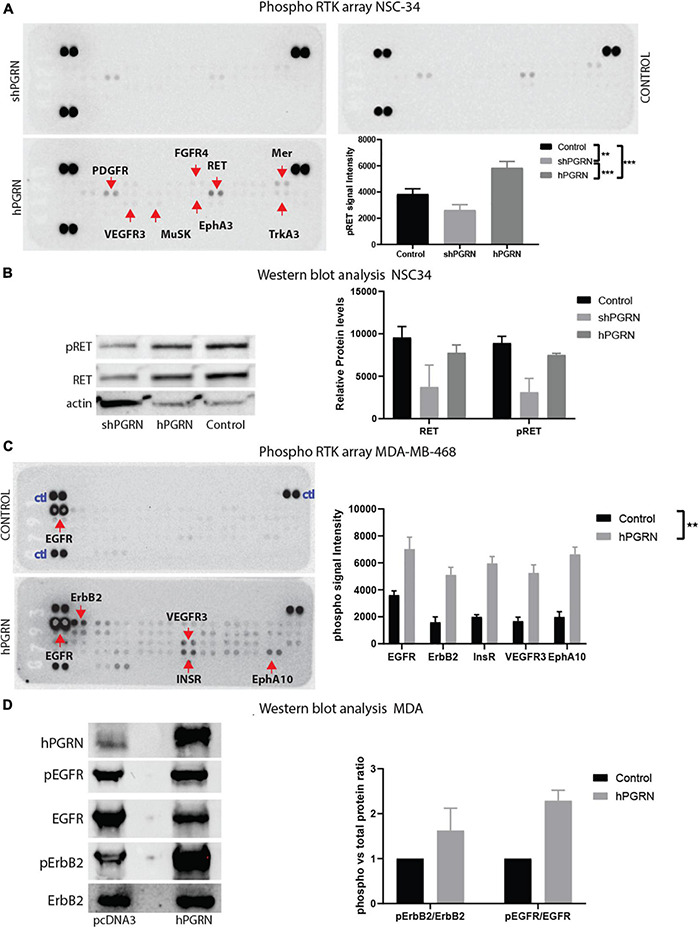
FIGURE 7.

PGRN expression levels influence RTK phosphorylation. (A) An RTK phosphotyrosine array shows increased tyrosine phosphorylation of multiple growth factor receptors including RET between NSC-34/shPGRN and NSC-43/hPGRN cells. (B) This was confirmed for RET, by Western blot analysis, while (C,D) in MDA-MD-468 cells PGRN expression increased tyrosine phosphorylation of a different set of receptors including EGFR, ErbB2, Insulin-R, VEGFR3, EphA10 (Exposure time is one minute except for ErbB2, which is approximately 10 min) (p < 0.001-***, p < 0.01-**, Error bars represent s.e.m.).
