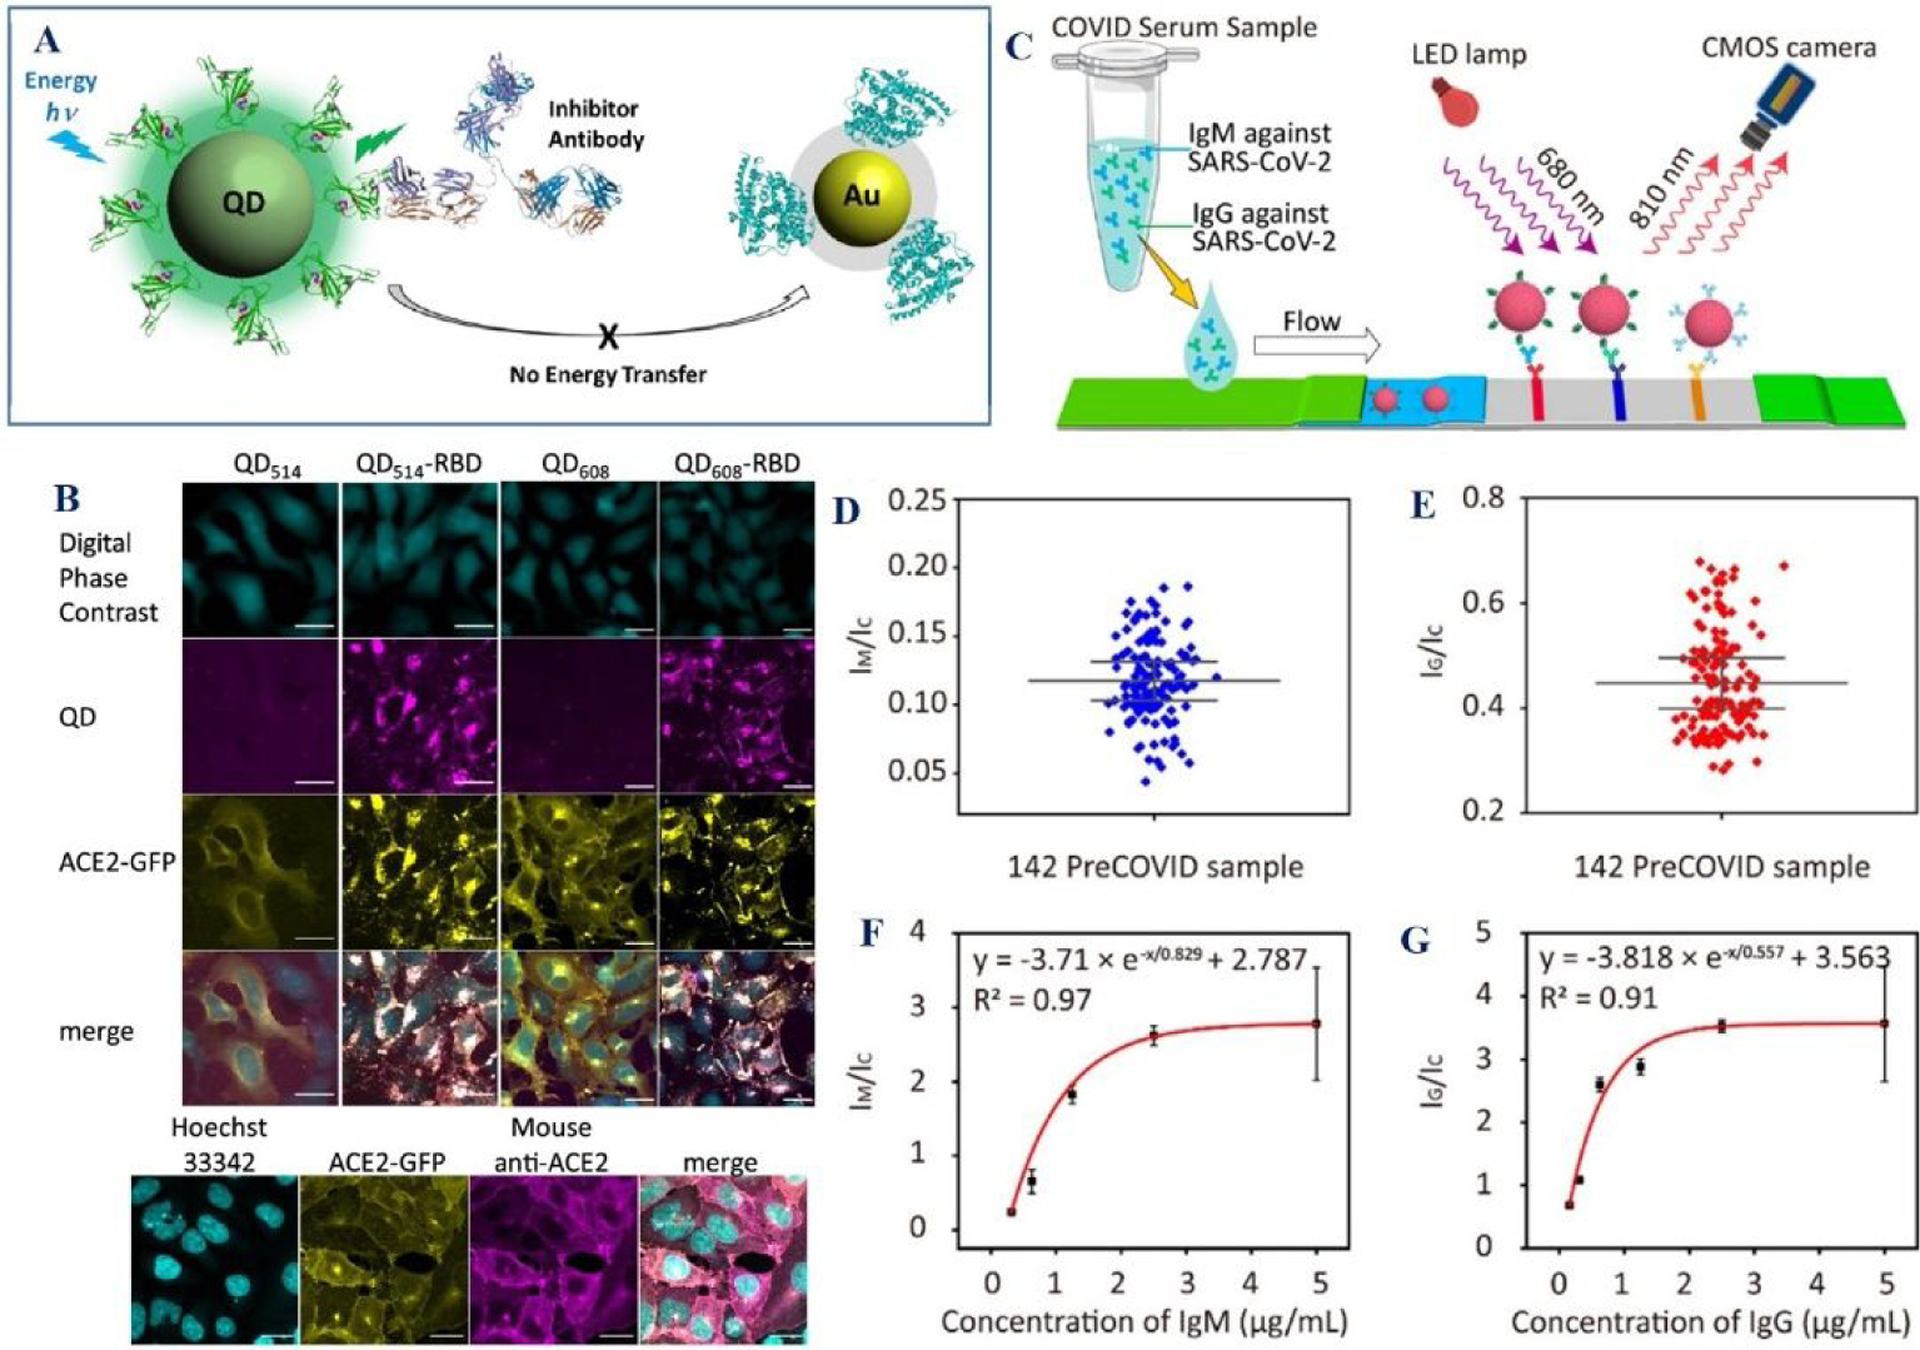
Figure 12:

A) The scheme shows the design of QD and gold nanoparticles -based FRET for finding the interaction between RBD and ACE2. B) Fluorescence image shows the image of ACE2-GFP (yellow) HEK293T clone 2 treated with 100 nM QD514-RBD (magenta) and QD608-RBD (magenta). Reproduced with permission from ref (30). Copyright 2020 American Chemical Society. C) The scheme shows the NIR-Emissive AIE Nanoparticle-Labeled Lateral Flow Immunoassay for Detection of IgM and IgG. D-E) Clinical sample performance of test strip for the detection of IgM and IgG in 142 pre-COVID samples. The error bars represent the standard deviation of the values. The standard deviation is calculated from the results of 142 independent tests. F) Calibration curve indicates the LoD of IgM is 0.236 μg mL‒1. G) Calibration curve indicates the LoD of IgG is 0.125 μg mL‒1. Reproduced with permission from Ref (19). Copyright 2021 American Chemical Society.
