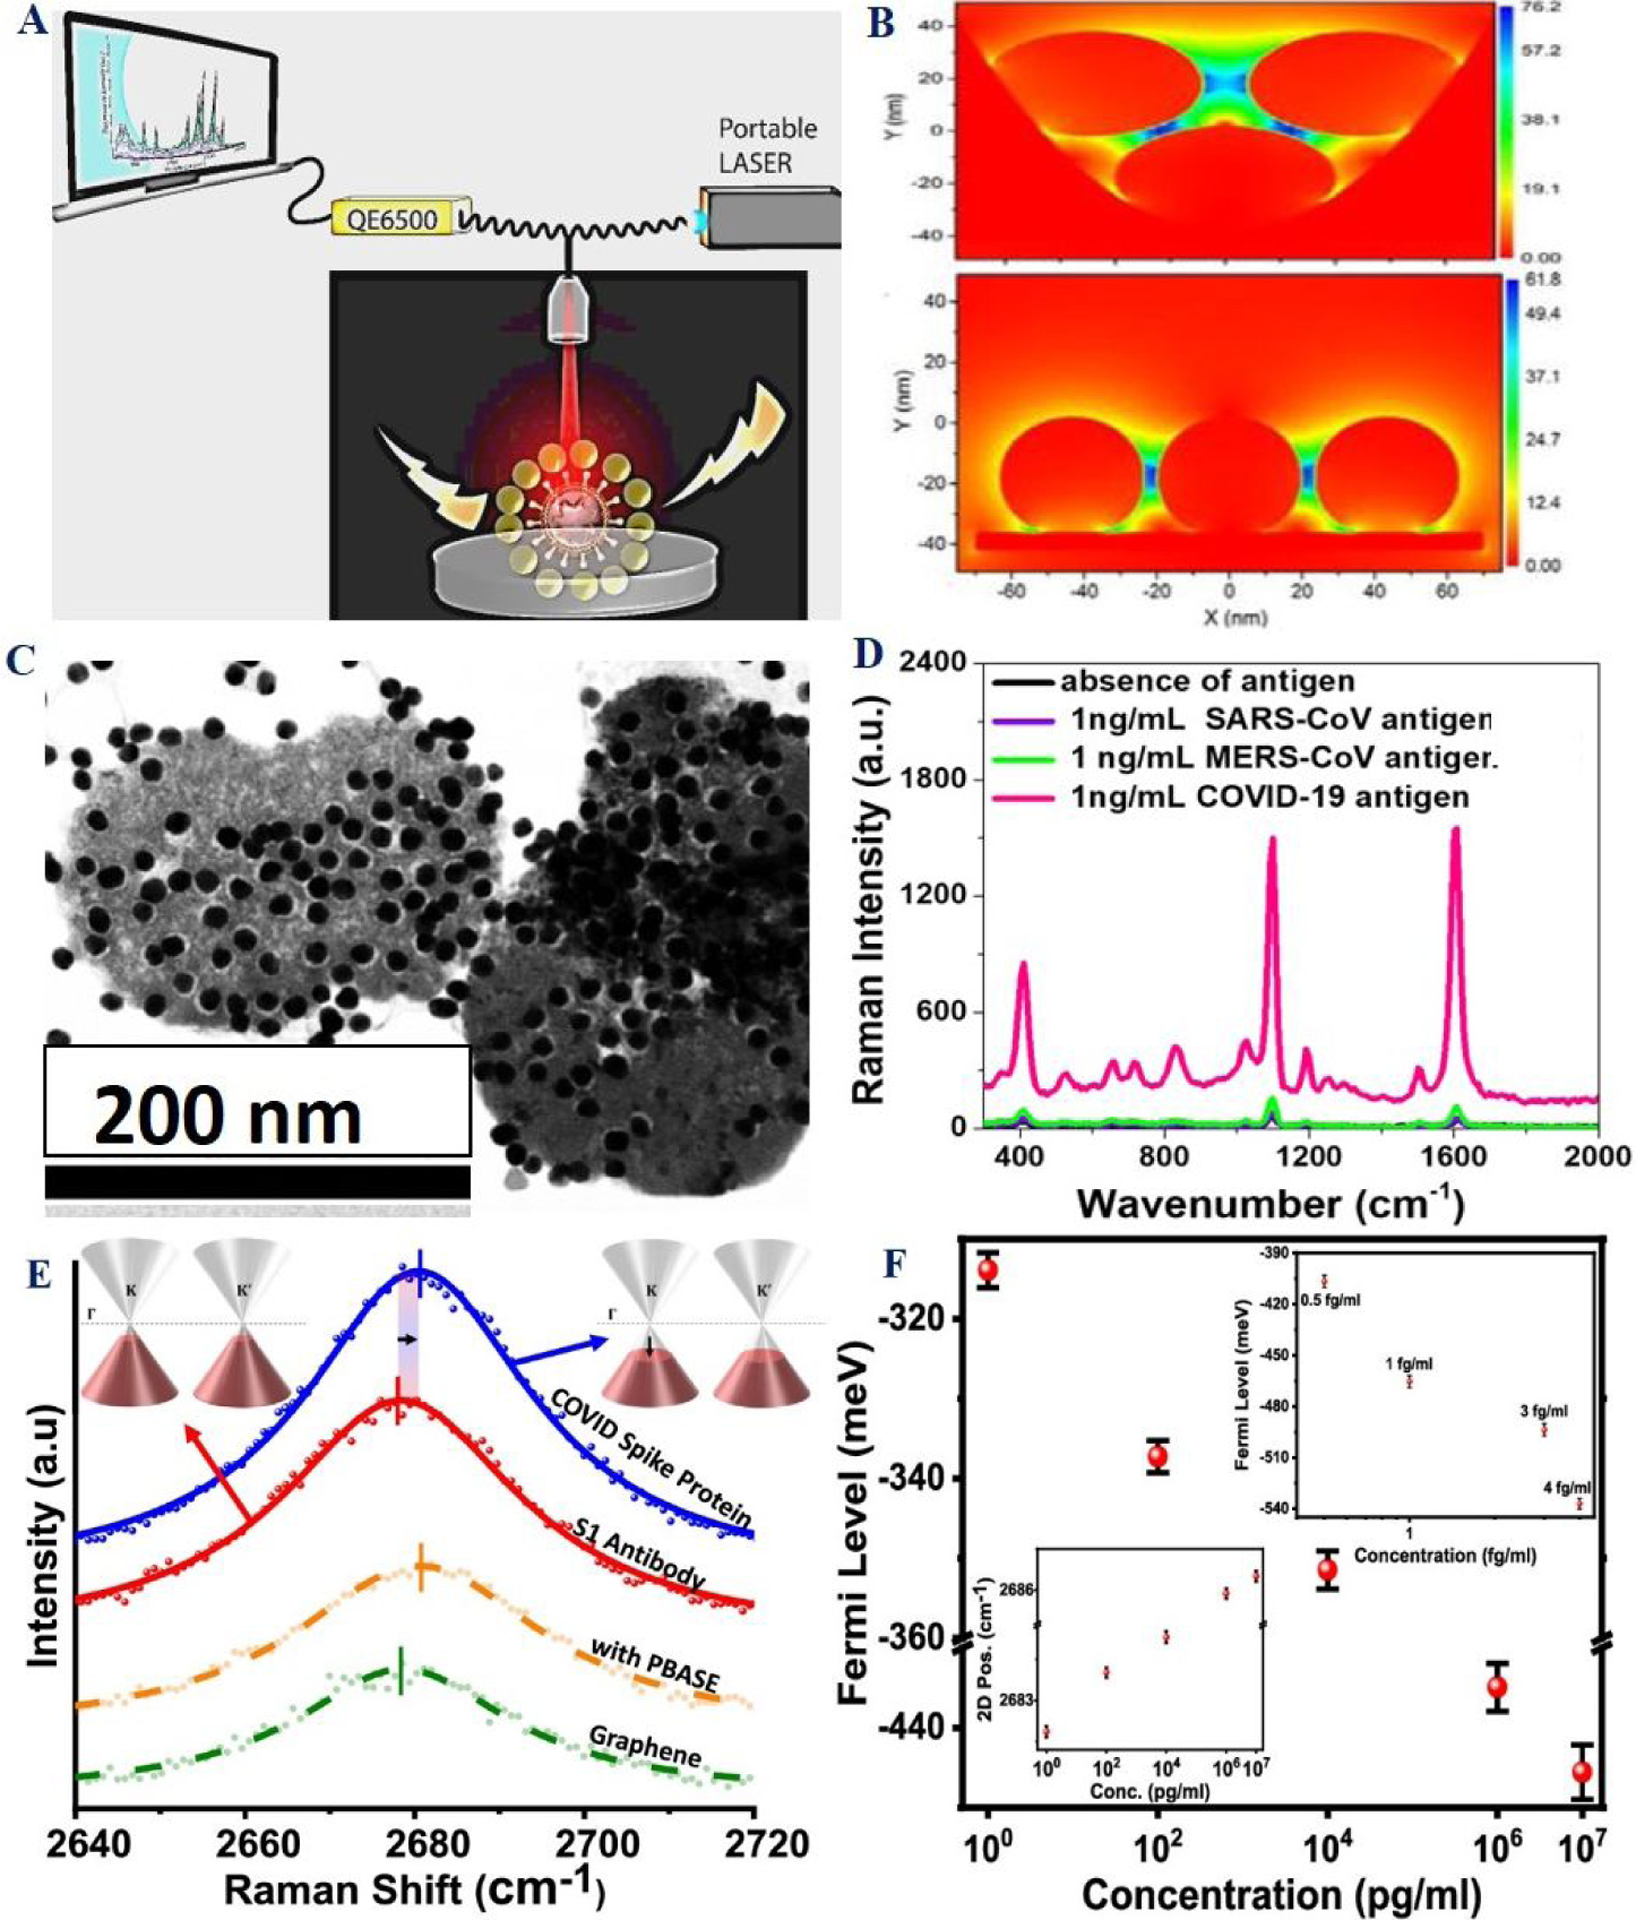
Figure 7:

A) Schematic representation of portable SERS probe used for biomolecule identification. B) FDTD simulation data show how electric field enhancement varies for three GNPs in bent and straight assembly structure. Reproduced with permission from Ref (53). Copyright 2016 Royal Society of Chemistry. C) TEM data represent the aggregation of the antibody attached gold nanoparticles on the surface of virus via antigen-antibody interaction. D) Selectivity of SERS assay for COVID-19 antigens. Reproduced with permission from Ref (23). Copyright 2021 Royal Society of Chemistry. E) Plot shows the detection of the COVID spike protein using graphene 2D Raman band. F) Plot shows the variation of the 2D peak position and the Fermi level of graphene with the concentration of the COVID spike protein. Reproduced with permission from Ref (38). Copyright 2021 American Chemical Society.
