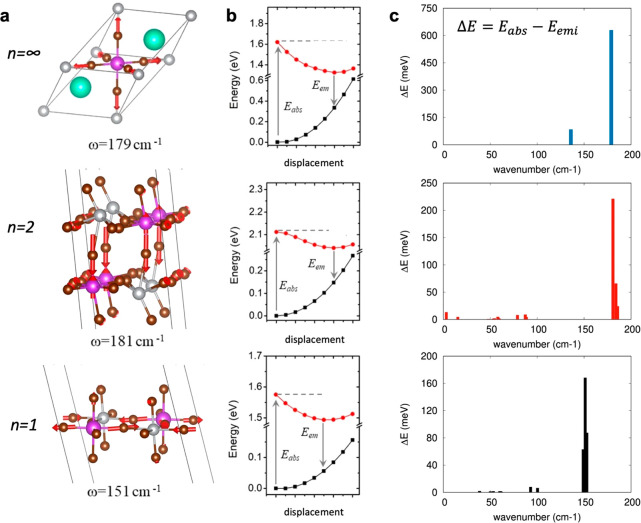
Figure 6.
(a) Displacement pattern for the computed vibrational modes with frequencies closer to the most intense Raman bands in Figure 5. (b) Corresponding ground (black)- and excited-state (red) PESs along the normal mode in (a). The Stokes shift was obtained from the difference between the absorption energy (Eabs) and the emission energy (Eem), with the total relaxation energy ΔE given as Eabs – Eem. (c) Contribution from all vibrational modes to the total relaxation energy ΔE.

