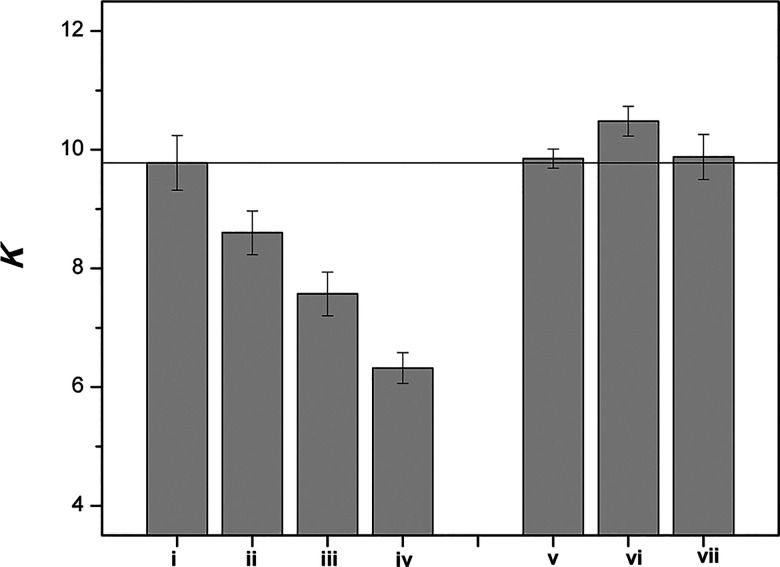
Figure 5.
Bar graph showing K in liposomes containing the following mole percentages of cholesterol/coprostanol: (i) 40/0, (ii) 30/10, (iii) 20/20, (iv) 2.5/37.5, and cholesterol/dihydrocholesterol: (v) 30/10, (vi) 20/20 and (vii) 2.5/37.5. Here, Chol was included in the cholesterol count. Error bars represent one standard deviation. All thiolate-disulfide exchange reactions were carried out at 45 °C. (Reprinted from ref (23). Copyright 2011 American Chemical Society.)

