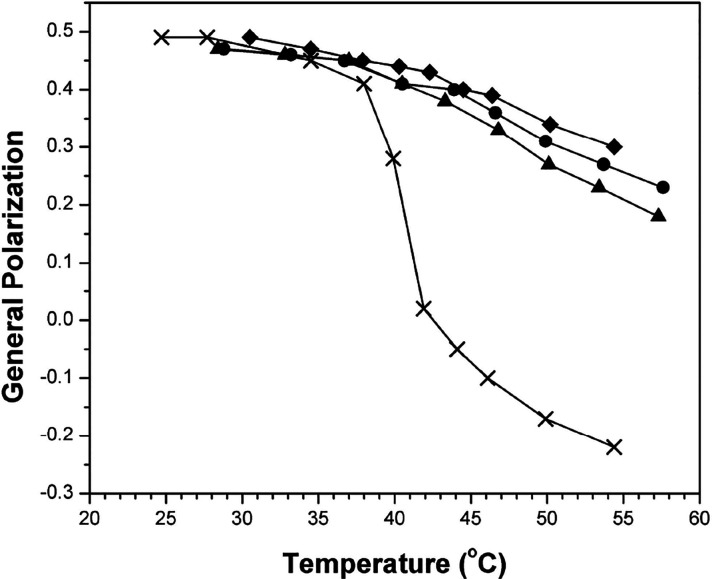
Figure 7.
Plot of general polarization versus temperature in liposomes made from DPPC/DPPG/cholesterol/DChol with the following molar percentages: (◆) 57.5/2.5/40/0; (●) 57.5/2.5/20/20; (▲) 57.5/2.5/0/40; (×) 95/2.5/2.5/0. Error values lie within the data points themselves. (Reprinted ref (37). Copyright 2014 American Chemical Society.)

