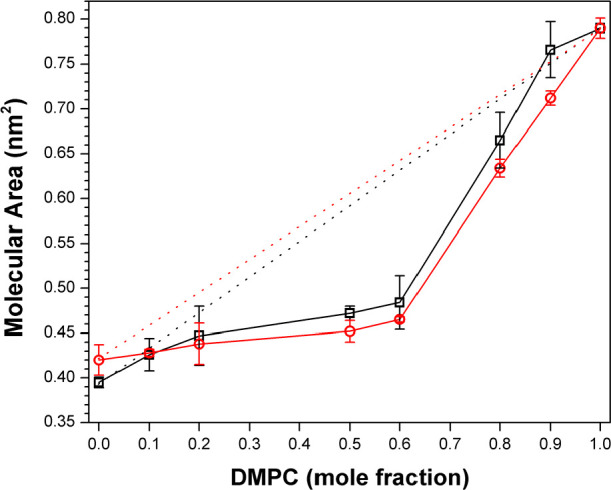
Figure 8.

Molecular area–-additivity curves for (□) DMPC/DChol and (○) DMPC/Chol with a surface pressure of 10 mN/m. Ideal additivities are shown by dotted lines. Error bars that are not visible lie within the symbols themselves. (Reprinted ref (37). Copyright 2014 American Chemical Society.)
