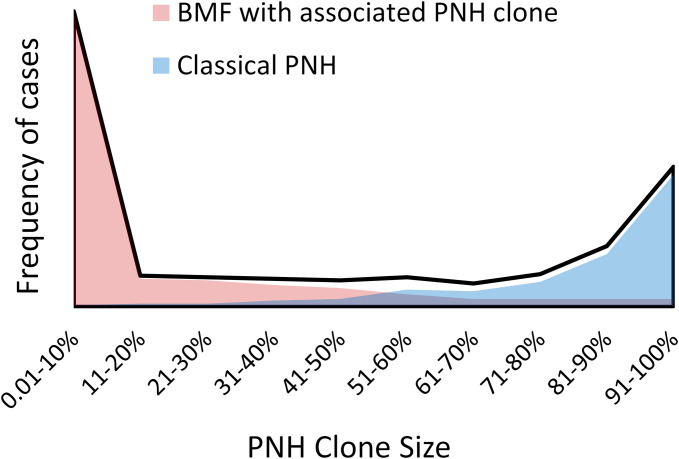
Figure 1.
The bimodal distribution of PNH clone sizes closely correlates with the patients' clinical presentations. The stylized schematic depicts the bimodal distribution of granulocyte PNH clone sizes (black line) based on published PNH clone size distributions.12,14 Red and blue area plots illustrate the different clinical presentations that correlate with the extremes of PNH clone sizes. Patients with bone marrow failure who have an associated PNH clone are shown in red. Classical PNH presentations are shown in blue.

