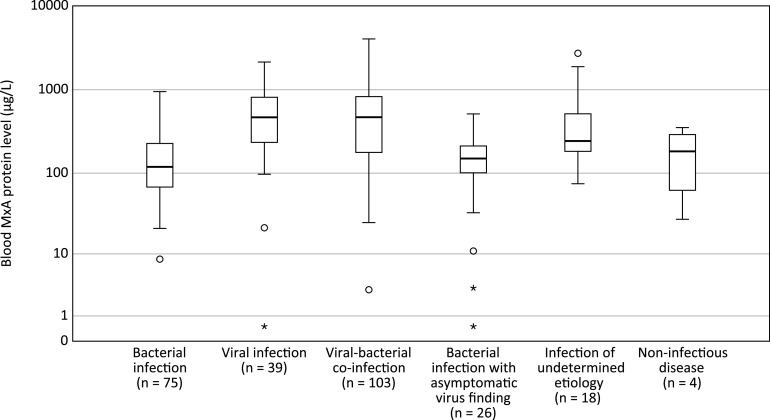
FIG 2.
Blood MxA protein levels in 265 children hospitalized with an acute infection according to the etiology. For each group, the horizontal line represents the median, the box the upper and lower quartiles, and the whiskers the 95% confidence interval (CI). Circles indicate outliers extending beyond 1.5 times and up to three times the interquartile range, and asterisks indicate extreme values beyond three times the interquartile range. For pairwise comparisons of the groups “viral infection” and “viral-bacterial coinfection” with “bacterial infection” and “bacterial infection with coincidental virus finding,” P < 0.001 for all comparisons (as determined by the Mann-Whitney U test).

