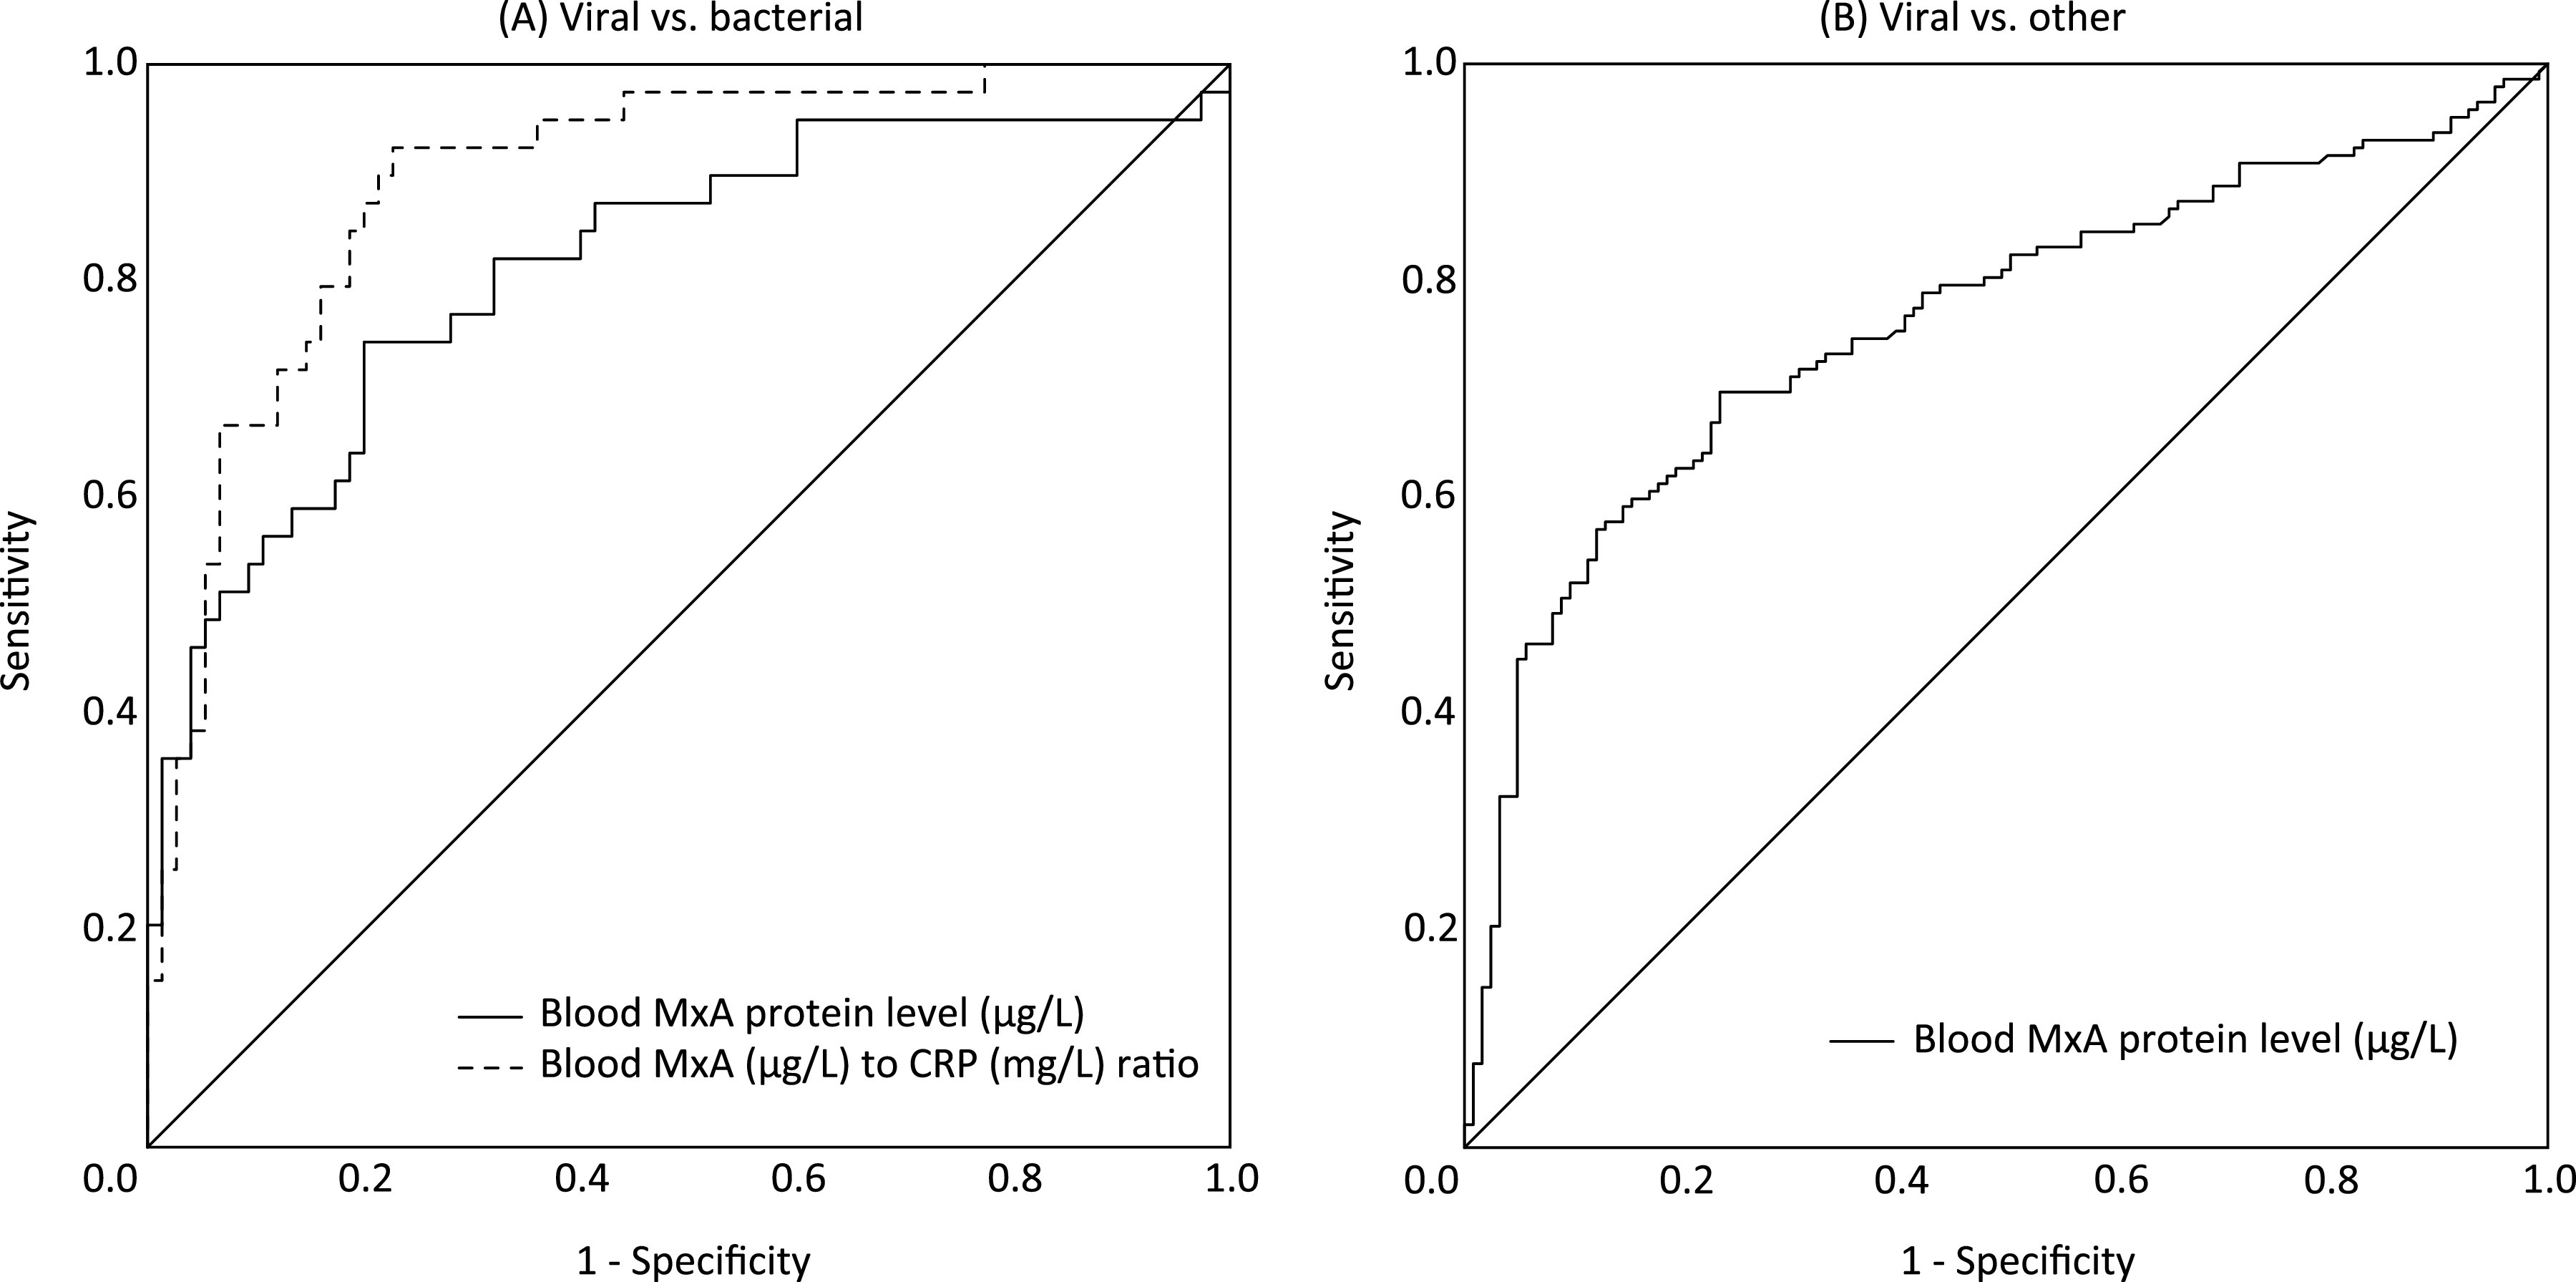
FIG 3.

Differentiation between viral and bacterial infections by MxA and MxA/CRP ratio. (A) Receiver operating characteristic (ROC) curves for blood MxA protein level and blood MxA (μg/L) to CRP (mg/L) ratio in differentiating between children with a viral (n = 39) or bacterial (n = 75) infection. Area under the curve (AUC) = 0.81 (95% CI = 0.73 to 0.90) and 0.89 (95% CI = 0.83 to 0.96), respectively. (B) ROC curve for blood MxA protein level in differentiating between children (n = 142) with a symptomatic viral infection with or without a simultaneous bacterial infection and children (n = 105) without a symptomatic viral infection. AUC, 0.79 (95% CI = 0.73 to 0.85).
