
Figure 2.
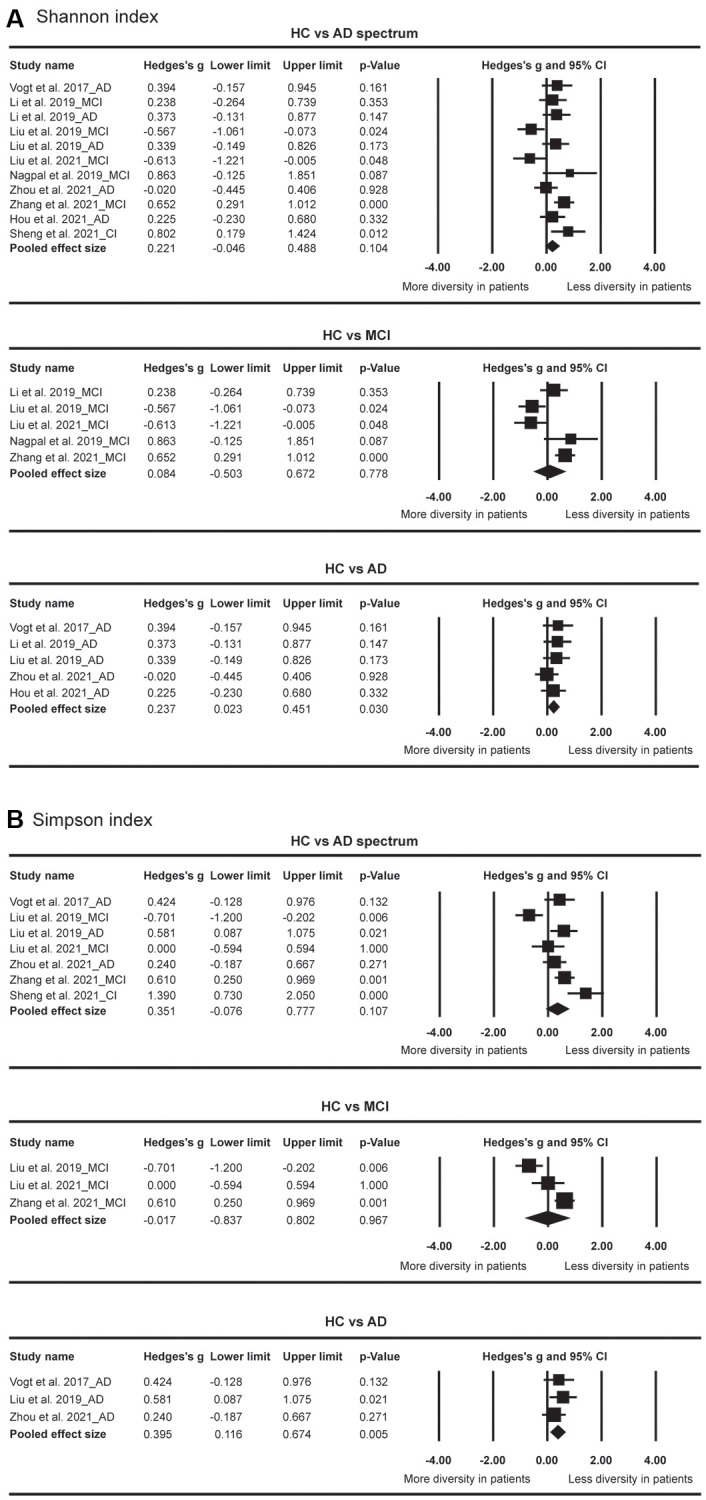
Forest plots of Shannon index (A) and Simpson index (B) in the comparisons between healthy controls (HC) and Alzheimer’s disease (AD) spectrum. Patients with AD spectrum consisted of mild cognitive impairments (MCI) and AD.
Official websites use .gov
A
.gov website belongs to an official
government organization in the United States.
Secure .gov websites use HTTPS
A lock (
) or https:// means you've safely
connected to the .gov website. Share sensitive
information only on official, secure websites.
Forest plots of Shannon index (A) and Simpson index (B) in the comparisons between healthy controls (HC) and Alzheimer’s disease (AD) spectrum. Patients with AD spectrum consisted of mild cognitive impairments (MCI) and AD.