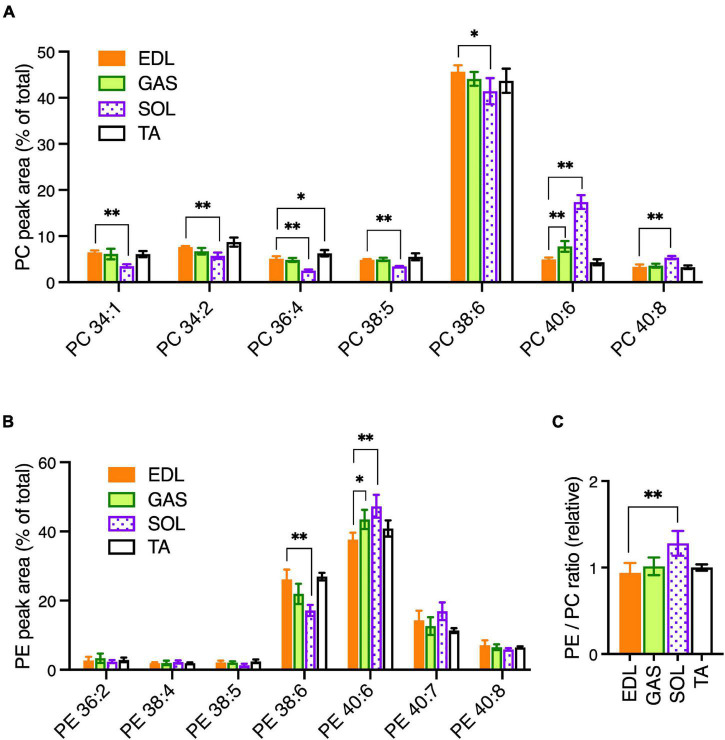
FIGURE 1.
PC and PE profiles in healthy EDL, GAS, SOL, and TA skeletal muscles of adult (15-week-old) C57BL/6 mice raised on CE-2 standard chow. PC (A) and PE (B) were measured by LC-MS/MS. EDL was selected as a standard muscle to determine the statistical variations. (C) Relative ratios of total detected amounts of PE to PC (ratio in EDL = 1). PC and PE peak values are expressed as the percentage of total PC or PE signals and means ± SD are plotted. The statistical significance of variations vs. EDL is based on Dunnett’s multiple comparison tests. *p < 0.05, **p < 0.01; n = 4 mice/group.

