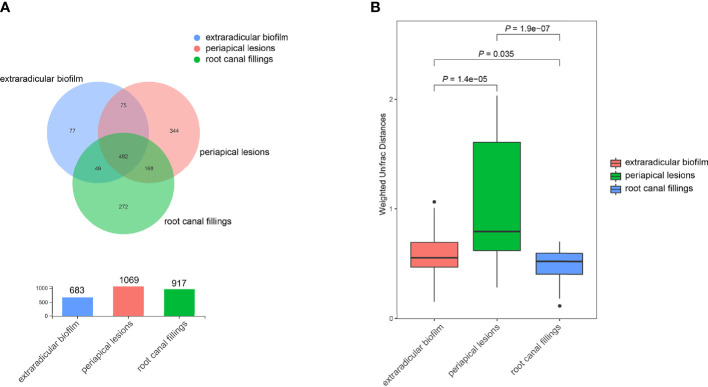
Figure 2.
Distribution of OTUs in samples collected from the root canal, extraradicular biofilm, and periapical lesions. (A) the Venn diagram indicates the shared/unique OTUs in samples from the root canal, extraradicular biofilm, and periapical lesions; (B) comparison of beta-diversities between samples within each group. The P-values were calculated using the student’s t-test.

