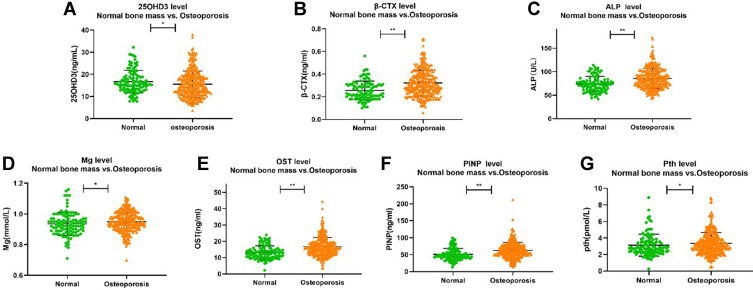
Figure 1.
The level of β-CTX, P1NP, ALP, Mg, Pth, OST and 25OHD3 between two groups. (A) comparison of 25OHD3 between groups. (B) comparison of β-CTX between groups. (C) comparison of ALP between groups. (D) comparison of Mg between groups. (E) comparison of OST between groups. (F) comparison of PINP between groups. (G) comparison of Pth between groups. *Denotes statistical significance with P<0.05; **denotes statistical significance with P<0.01.

